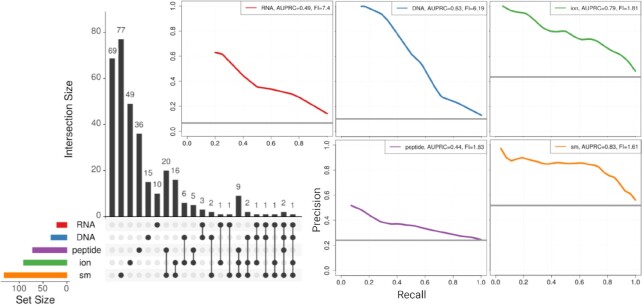
Figure 5.
Performance in predicting the ligand type a domain binds. PR curves for predicting whether a domain binds a ligand using 5-fold cross-validation. For each ligand type, the grey horizontal line represents the random baseline corresponding to the fraction of positives in the training dataset. For each ligand, AUPRC and AUPRC-FI are given in an inset on the top-right of the panel. An UpSet plot (67) on the left shows the numbers of domains binding each of the ligands (i.e., the sizes of the training sets) as horizontal bars. The sizes of the intersections between the sets of domains known to bind these ligands are shown with a vertical bar plot.

