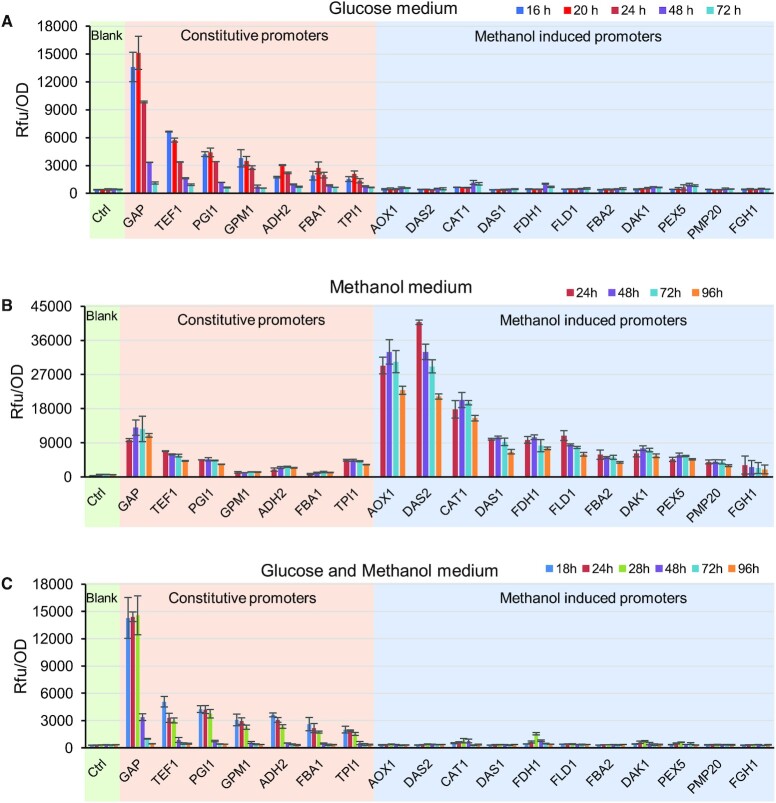
Figure 6.
Time-dependent profiling of various promoters with glucose or methanol as carbon source. (A) The fluorescence of eGFP controlled by various promoters in minimal glucose medium. (B) The fluorescence of eGFP controlled by various promoters in minimal methanol medium. (C) The fluorescence of eGFP controlled by promoters in minimal medium containing 20 g/l glucose and 10 g/l methanol. Supplementary Figure S8 contains cell growth and carbon source profiles can be found in. All data represent the mean ± s.d. of three independent yeast clones.

