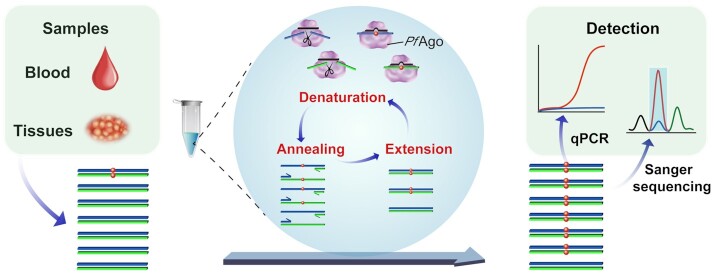
Figure 1.
Schematic representation of the A-Star approach for rare mutation enrichment. Black lines represent gDNA and blue and green lines represent forward and reverse strands of target dsDNA, respectively. The coordinating-colored lines with arrows above or below the blue and green lines represent the forward and reverse primers. Red dots indicate the mutated nucleotides of SNV targets.

