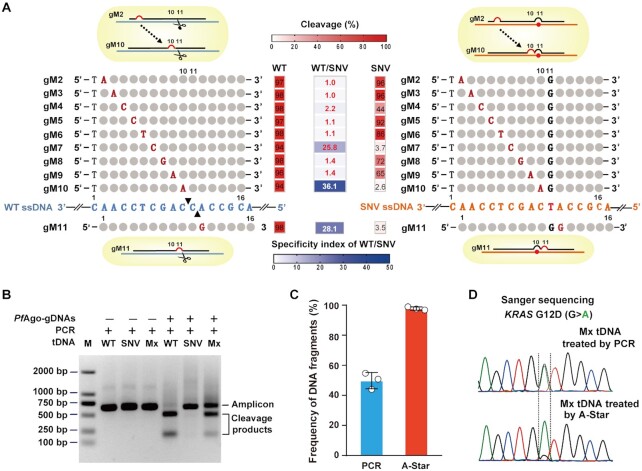
Figure 2.
Discriminant DNA cleavage by designed gDNAs and suitability of PfAgo use in PCR in a single-tube reaction for SNV enrichment. (A) Schematic representation of designed gDNAs for KRAS G12D ssDNA cleavage and heat map analysis of the gel detection results for the designed mismatched gDNA directed cleavage on WT and SNV targets. Of the designed gDNAs, the introduced mismatched nucleotides are indicated by red capital letters, the nucleotides corresponding to the SNV site are indicated by black capital letters, and the remaining nucleotides pairing to the ssDNA target are represented by grey circles. The black triangles on the WT ssDNA represent the specific cleavage sites. The cleavage (red heatmaps) was quantified by measuring the electropherograms of the cleavage products with the ssDNA target of KRAS G12D WT or SNV directed by the mismatched gDNAs. The specificity index of WT/SNV (blue heatmap) is the ratio of the cleavage percentage (%) of WT to that of SNV directed by the mismatched gDNAs. (B) Gel electrophoresis analysis for the PfAgo-PCR coupled reaction to cleave WT sequences and enrich SNVs. Mx: a mixture of WT and SNV target at equal molar concentrations. (C) TaqMan qRT-PCR evaluation of the enrichment results tested with a mixture of WT and SNV targets at equal molar concentrations treated by PCR or PfAgo-PCR coupled reaction. Error bars represent standard deviations of the means, n = 3. (D) Sanger sequencing evaluation of the enrichment results tested with a mixture of WT and SNV targets at equal molar concentrations treated by PCR or PfAgo-PCR coupled reaction.

