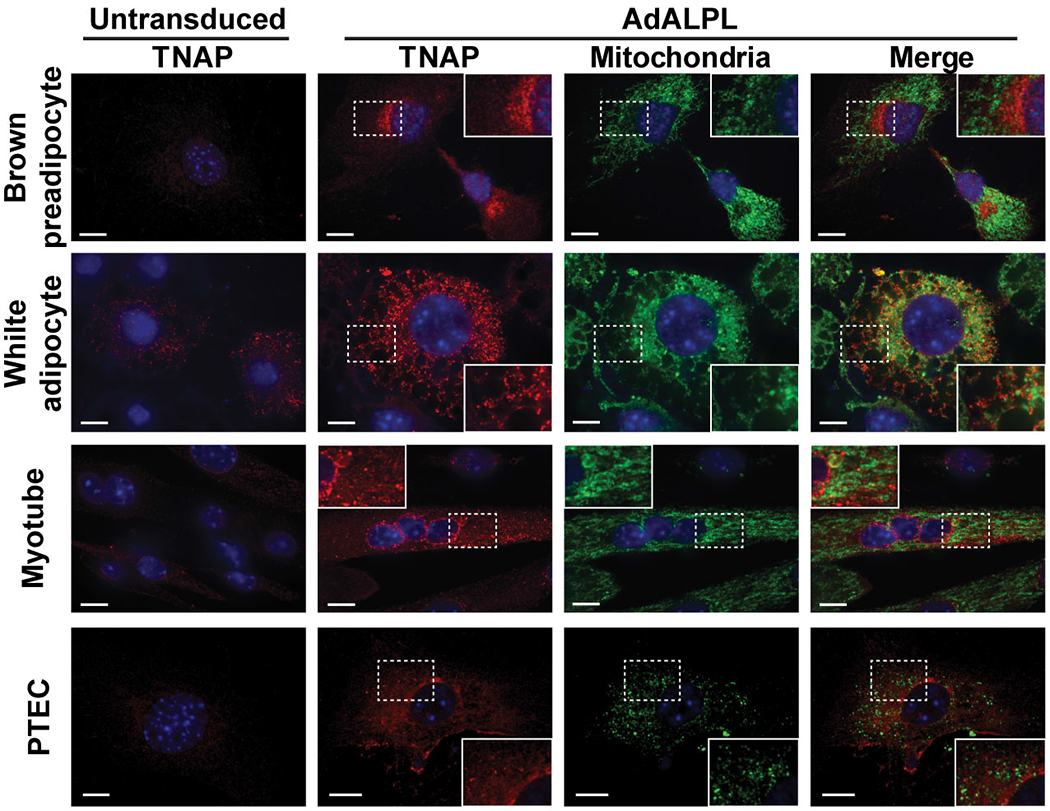
Extended Data Figure 2. Mitochondrial localization of ectopically expressed TNAP in non-thermogenic fat cell types.

Confocal fluorescence microscopic images showing subcellular localization of ectopically expressed TNAP in different cell types. PTEC stands for kidney proximal tubule epithelial cells. The insets show a zoomed-in region of the image outlined by a dotted box. Anti-TNAP and anti-HSP60 were used to visualize TNAP and mitochondria, respectively. Scale bar: 10 μm.
