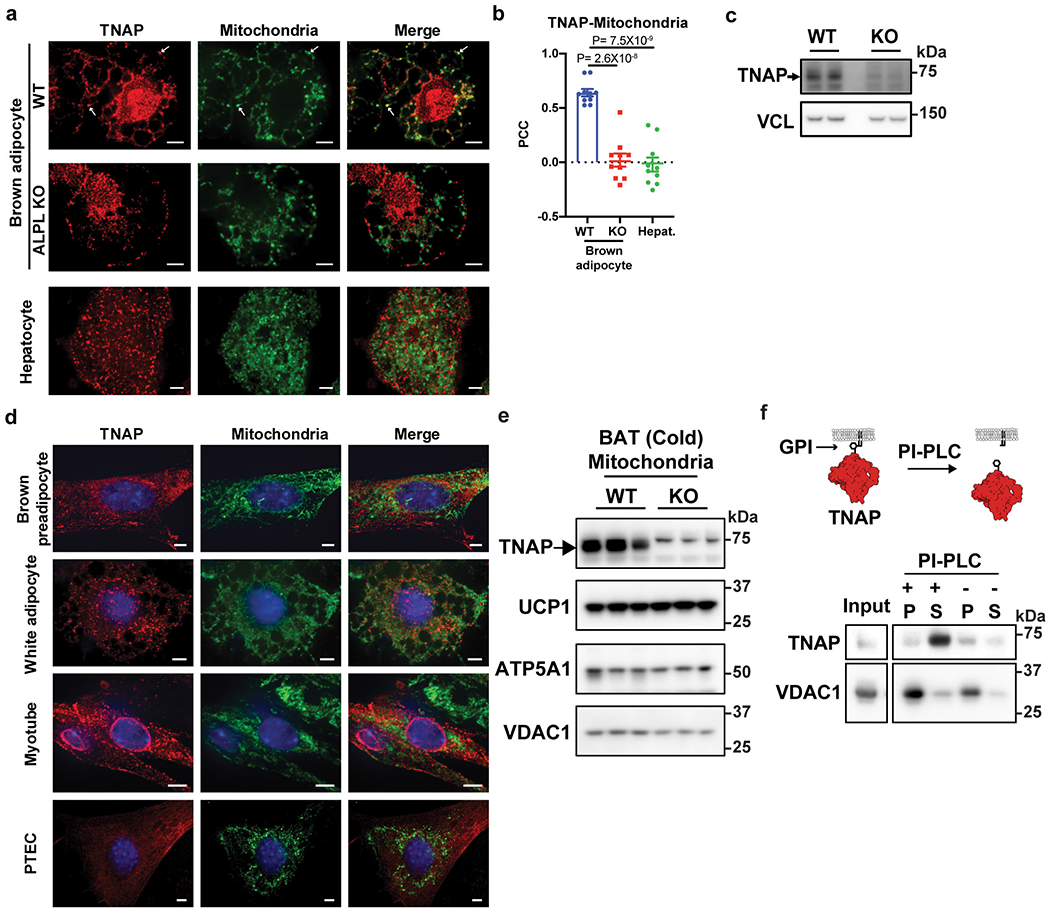
Extended Data Figure 3: Mitochondrial localization of endogenous TNAP in BAT and non-thermogenic fat cells.

(a) Confocal fluorescence images showing subcellular localization of endogenous TNAP in brown adipocytes (upper and middle panels) and hepatocytes (lower panels). Primary brown preadipocytes were prepared from Alpl fl/fl mice, transduced with either AdGFP (WT) or AdCRE (ALPL KO) on day 4 of differentiation, and fixed for imaging on day 8. Arrows denote selected peri-nuclear areas of TNAP signal that colocalize with mitochondria signal. Antibodies for TNAP (Red) and HSP60 (Green) were used to visualize TNAP and mitochondria. Scale bar: 5 μm.
(b) Pearson’s Correlation Coefficient (PCC) analysis showing the extent of colocalization of TNAP with mitochondria in indicated cell types; n=10 cells per group; data are presented as means ± SEM; statistical significance was calculated by one-way ANOVA with Bonferroni’s multiple comparisons test.
(c) Western-blot analysis on TNAP in WT versus KO cells. Vinculin (VCL) blot was used as a sample preparation control.
(d) Confocal fluorescence microscopic images showing subcellular localization of endogenous TNAP in different cell types. PTEC stands for kidney proximal tubule epithelial cells. Anti-TNAP and anti-HSP60 were used to visualize TNAP and mitochondria, respectively. Scale bar: 5 μm.
(e) Western-blot analysis on TNAP and mitochondrial markers in mitochondria preparations from BAT of cold-acclimated, WT vs Adipo-Alpl KO mice. Blots were processed in parallel with samples derived from the same experiment.
(f) Western-blot analysis of the insoluble fraction of mitochondria extract treated with Phospholipase-C, phosphatidylinositol-specific (PI-PLC), followed by ultracentrifugation, showing that PLC treatment releases TNAP from membranes. P: pellet; and S: supernatant. Mitochondria preparation was fragmented by sonication before treatment. Blots were processed in parallel with samples derived from the same experiment.
