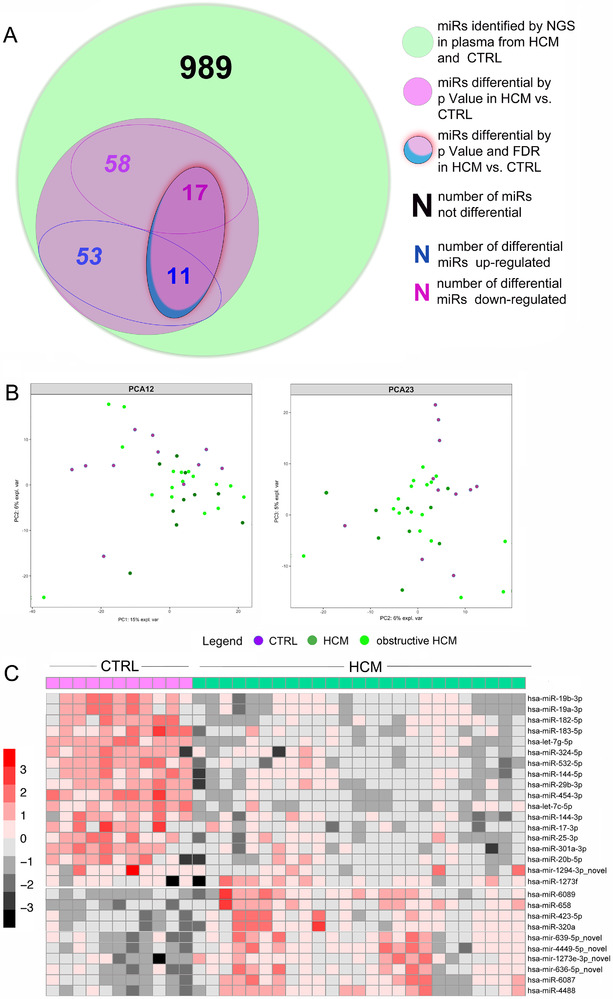
FIGURE 1.

NGS analysis of plasma miRs. Venn diagram representation of the plasma miRs up‐/down ‐regulated in HCM patients vs. CTRL by NGS (A) and corresponding scatterplots of principal component analysis (PCA) of patients and controls screened by NGS (B) showing no remarkable discrete clustering of the non‐obstructive HCM (HCM in the panel) vs. obstructive HCM vs. CTRL. Heatmap of the relative expression of miRs differential by NGS displays the existence of finest difference in miR expressions between HCM and CTRL (C)
