Figure 3.

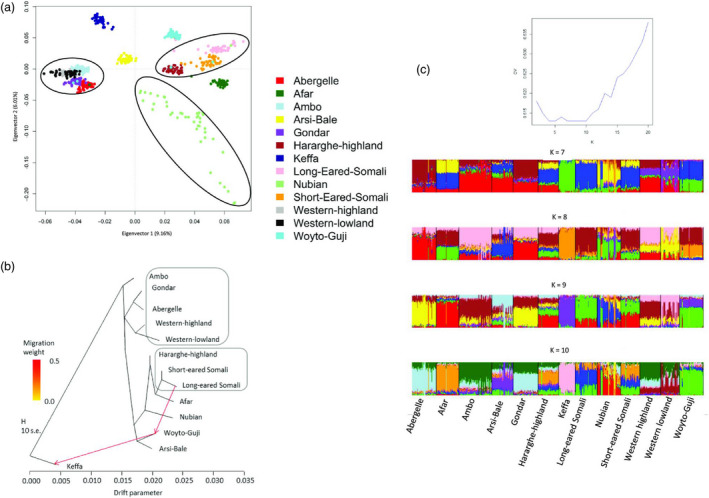
(a) Principal component analysis plot. (b) Tree Mix phylogenetic tree. (c) Plots of CV error against K and ADMIXTURE displays for 7 ≤ K ≤ 10

(a) Principal component analysis plot. (b) Tree Mix phylogenetic tree. (c) Plots of CV error against K and ADMIXTURE displays for 7 ≤ K ≤ 10