Figure 5.

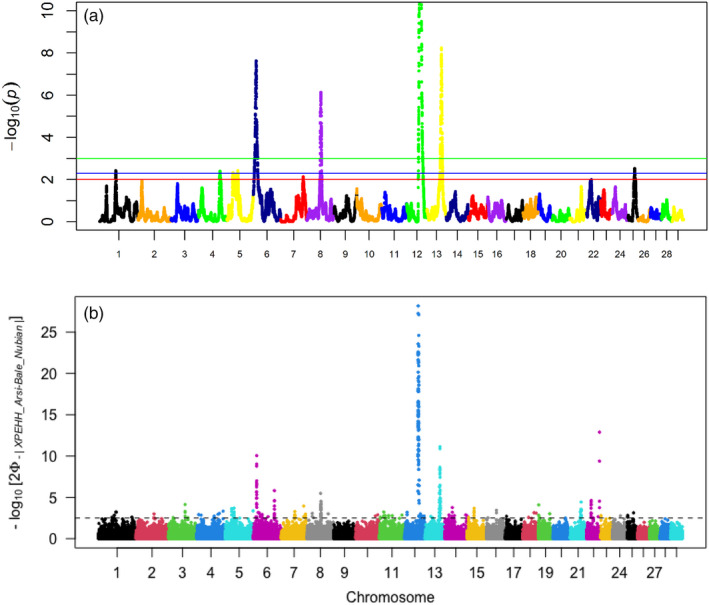
Genome‐wide hapFLK statistics between Arsi‐Bale and Nubian goat populations. Green and red lines correspond to p < .005 and <.001, respectively

Genome‐wide hapFLK statistics between Arsi‐Bale and Nubian goat populations. Green and red lines correspond to p < .005 and <.001, respectively