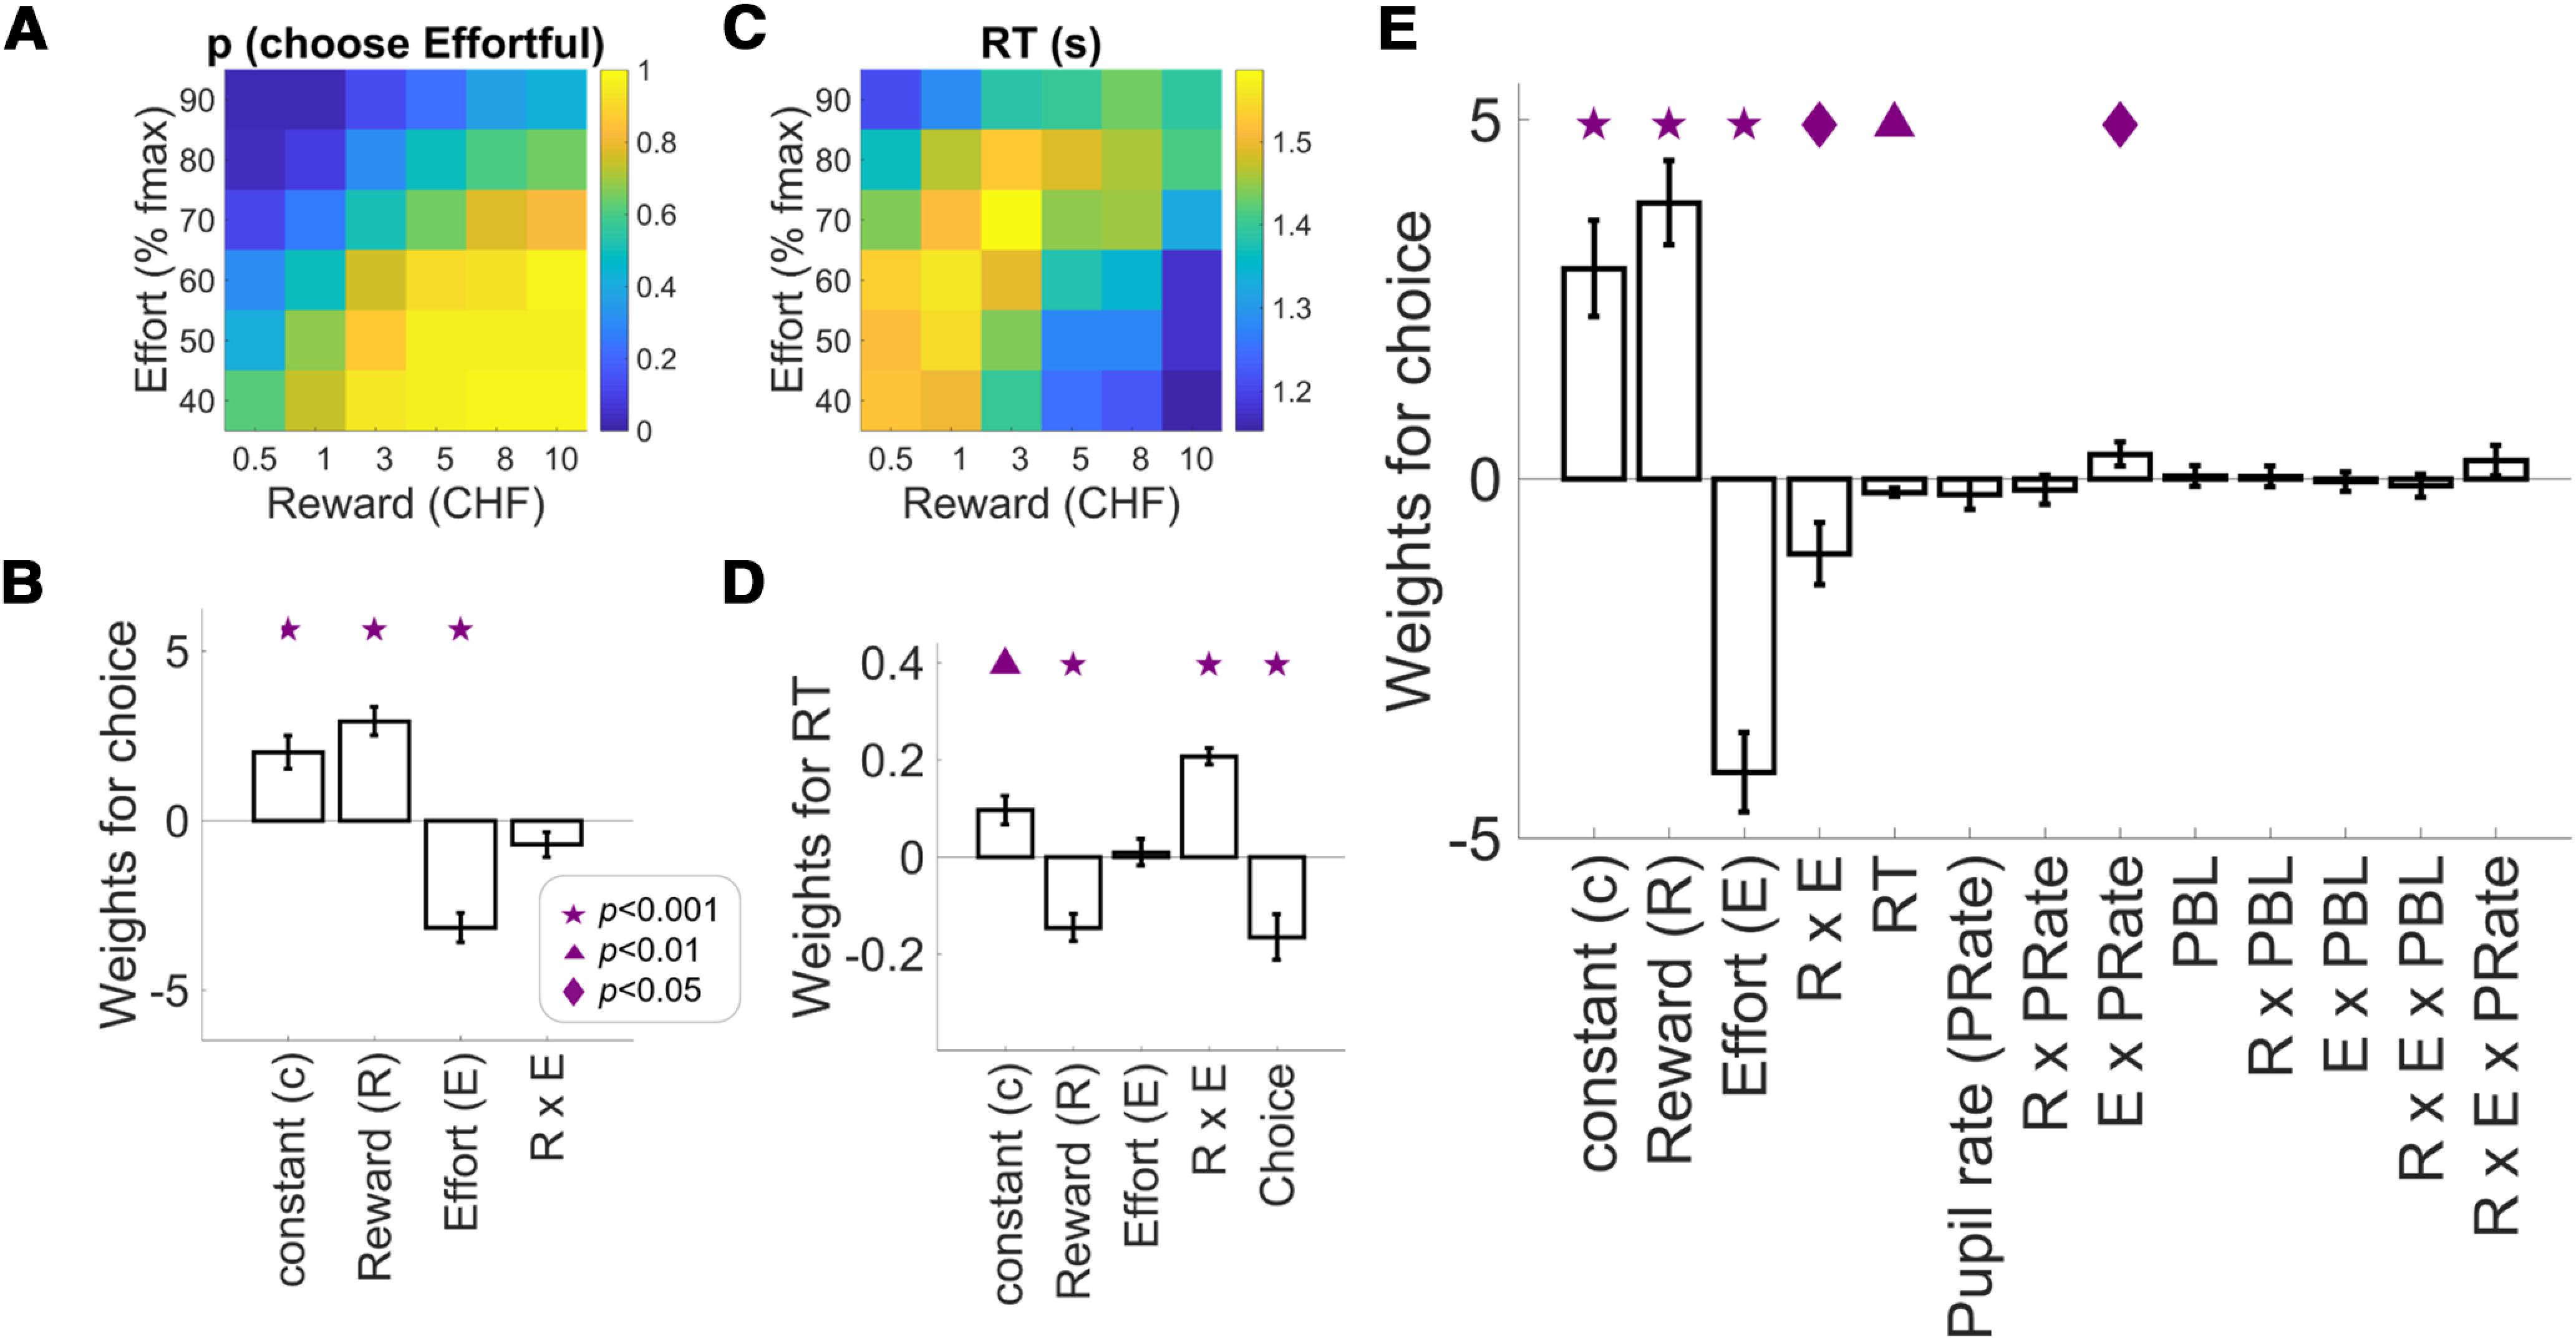
Figure 2.

Behavioral and pupil results. Choice proportions (A) and RT (C) as a function of reward and effort associated with the effortful option. B, Weights of logistic regression of choice on reward, effort, and the interaction from a standard model based on the offers the participants see on the screen. D, Weights of multiple regression of RT on reward, effort, and the interaction from a standard model based on the offers the participants see on the screen and the choice outcome. E, Weights of logistic regression of choice from an extended model containing the standard model, RT, pupil rate, and other variables (see Results), showing a significant effort-by-pupil rate interaction. This extended regression (E) had a higher model-fit (adjusted R2) than the standard one (B; see Results), suggesting that pupil measures together with other task parameters can explain choice above and beyond the standard option attributes (reward and effort). Symbols indicate significance levels against zero: star for p < 0.001, triangle for p < 0.01, diamond for p < 0.05. Bar plots display mean ± 1 SEM. RT=response time; PBL=pupil baseline level.
