Figure 3.

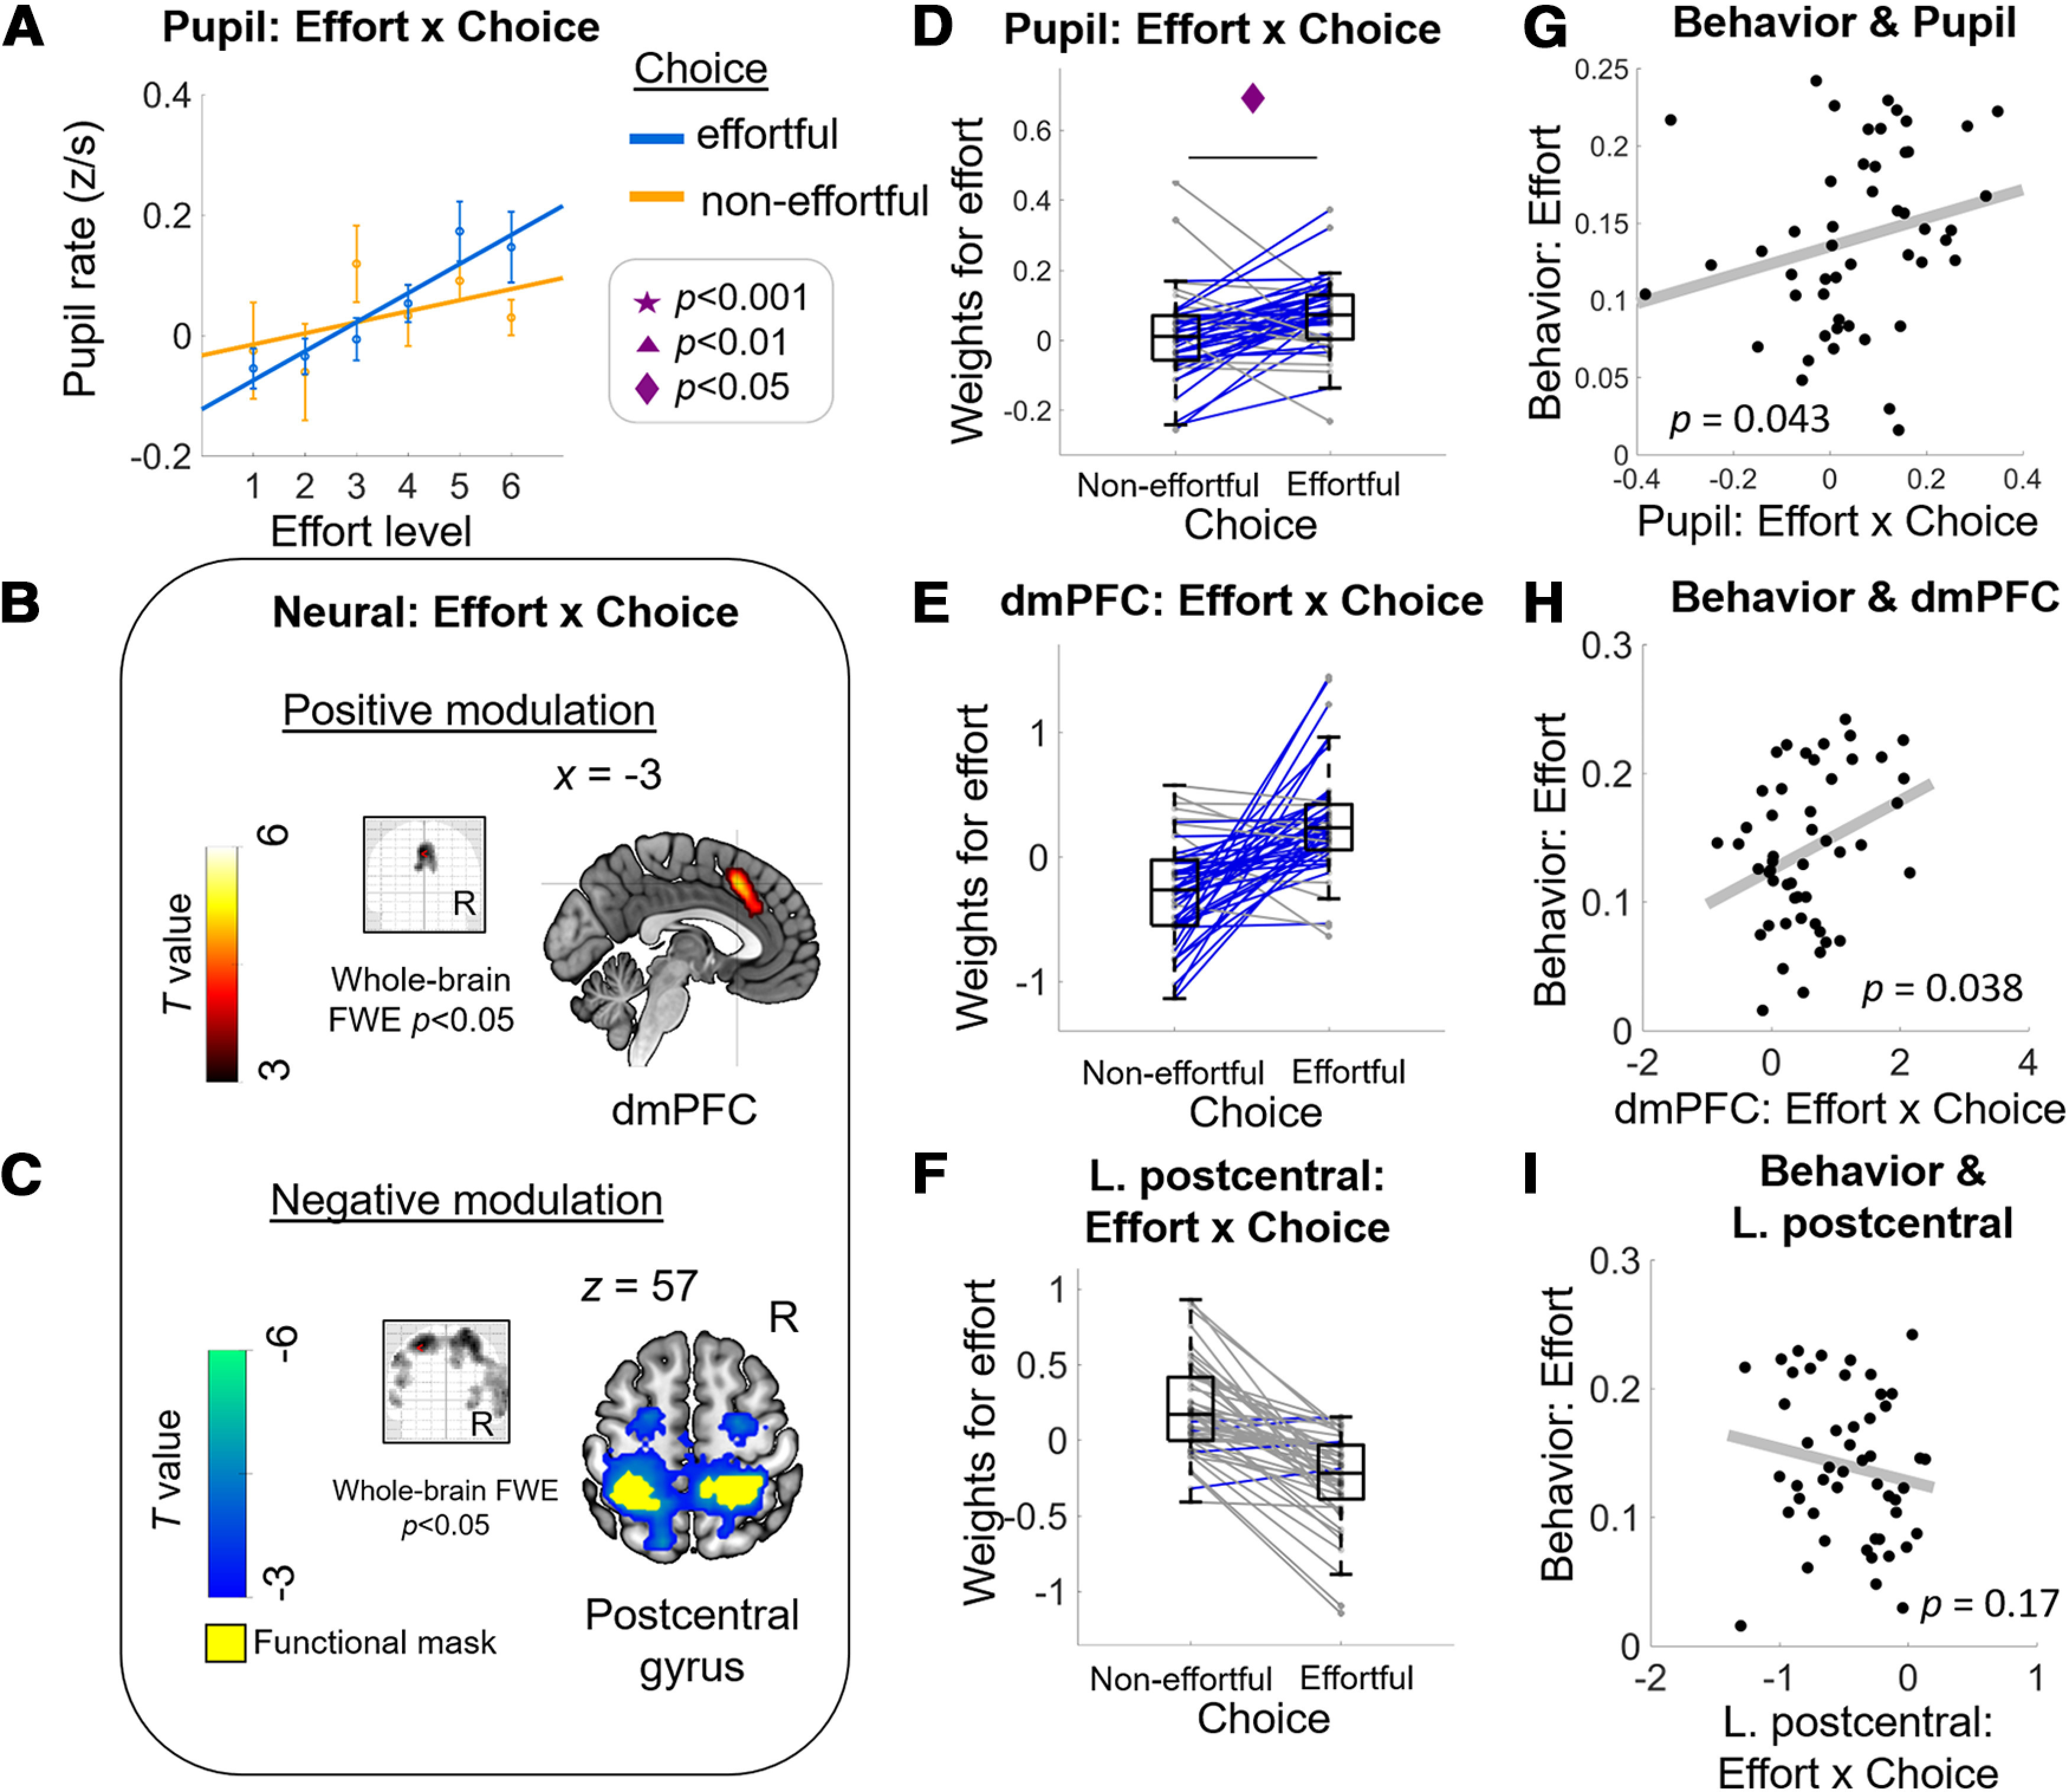
Energization signals in pupil and dmPFC activity correlated with behavioral effort sensitivity. Consistent with the energization scenario, effort representations in pupil (A) and in the dmPFC (B) are higher when participants accepted compared with when they rejected the effortful option (choice “effortful” vs “non-effortful”). The positive modulation of effort-by-choice interaction is evidenced by higher effort β weights when participants chose the effortful (“yes” decision) versus the non-effortful option (“no” decision) in pupil (D) and in extracted BOLD signal change within dmPFC functional ROI (E). Both the pupil (G) and dmPFC (H) energization signals are positively correlated with individual behavioral measure of effort sensitivity as shown in Figure 1C. Consistent with neural processes that may reflect cost signaling, effort β weights in an extensive cluster with its peak in the postcentral gyrus (C, F) are higher when participants rejected compared with accepted the effortful option. However, the extracted cost signal within left postcentral gyrus functional ROI did not show evidence of any relation with the behavioral measure of effort sensitivity (I). A, Dots with error bars represent means ± 1 SEM. Lines are linear fits of the means [using the MATLAB polyfit(x,y,1) function]. B, Glass-brain image and sagittal slice showing that BOLD amplitude in dmPFC correlates uniquely with (positive) effort-by-choice regressor. C, Glass-brain image and coronal slice showing that BOLD amplitude in bilateral postcentral gyrus correlates uniquely with the (negative) effort-by-choice regressor. Panels E, F are solely for illustration purposes; no statistical test was done. Middle column, Boxplots display the median (central line), 25th and 75th percentiles (bottom and top edges), and non-outlier low and high extreme values (bottom and top error bars). Blue lines show subjects whose effort slope is higher in effortful choice than in non-effortful choice, gray lines show subjects who show the opposite effect. Symbols indicate significance levels between two conditions: star for p < 0.001, triangle for p < 0.01, diamond for p < 0.05. Right column, Each data point represents a subject; p values represent significance level from robust regressions.
