Figure 8.
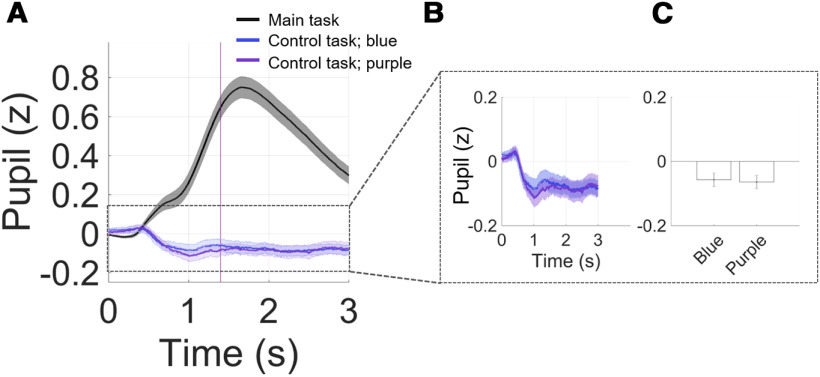
Pupil during main versus control experiment. A, Pupil time course in main and in control task for stimuli in blue and purple ink, subtracted by PBL. Inset, (B) Zoomed-in pupil time course and (C) averaged pupil size across 3 s, showing no difference in pupil responses between blue and purple. Bar plots display mean ± 1 SEM.

