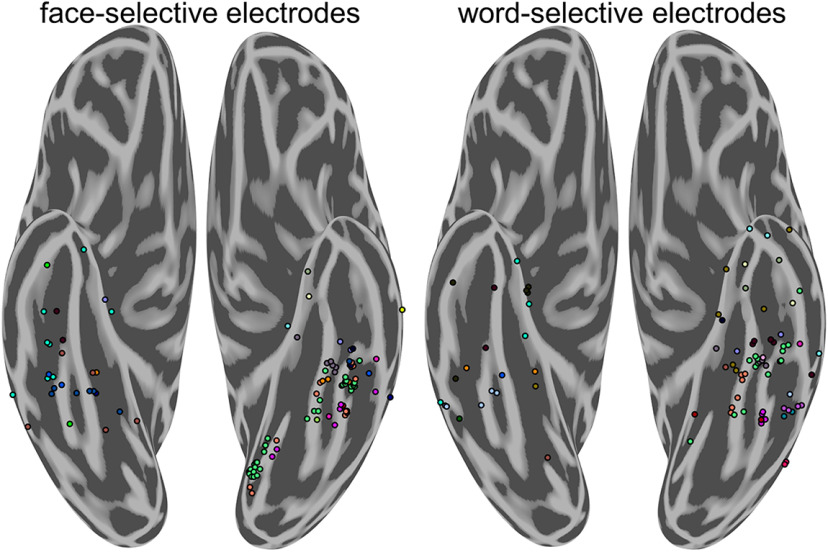
Figure 2.
Distribution of face-selective and word-selective electrodes by participant. Distribution of highly face-selective (left) and word-selective (right) electrodes by participant. Color represents individual participants and corresponds across figure panels. Each group-level cluster of word- and face-selective electrodes is represented by data from multiple participants.

