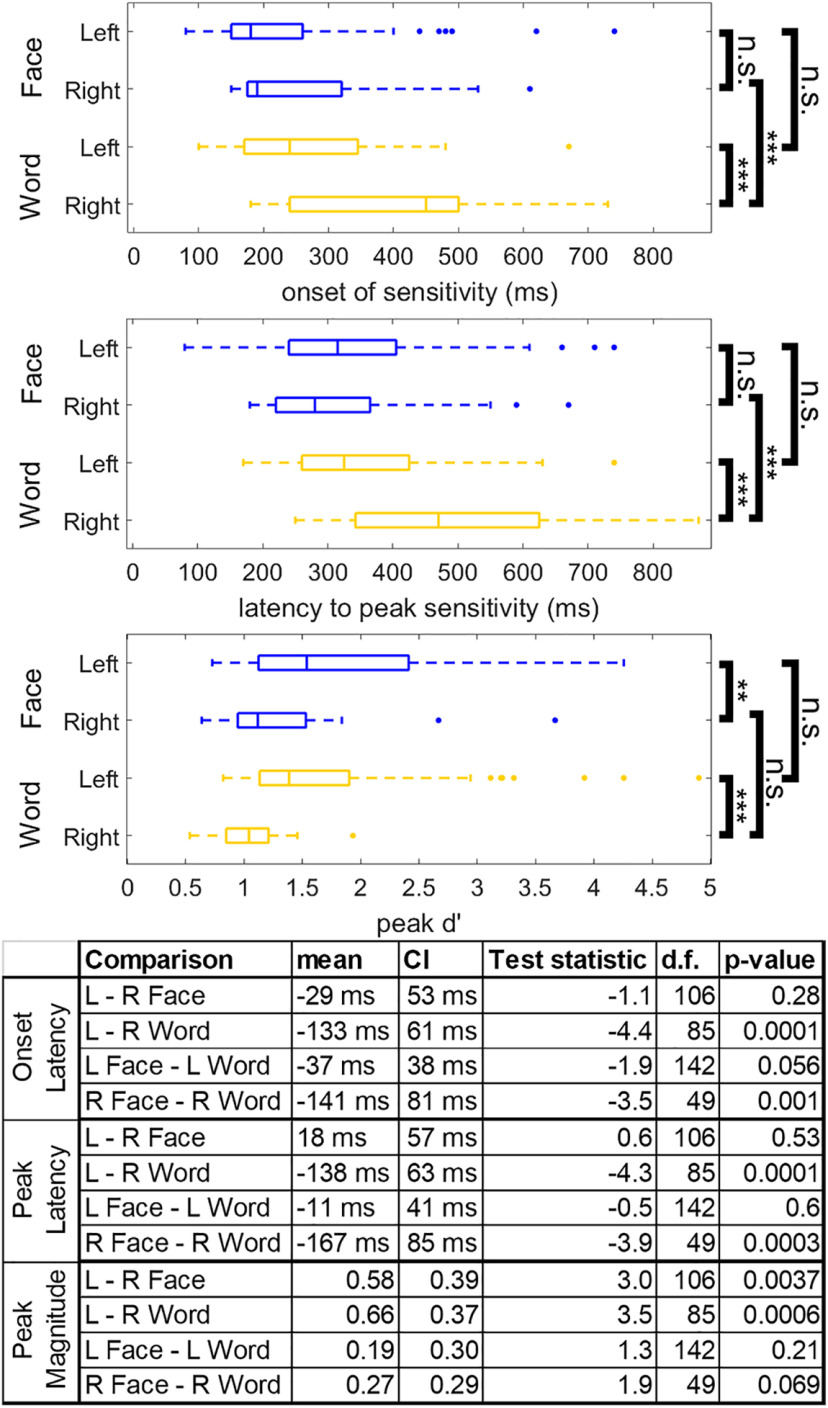
Figure 7.
Differences in the dynamics of left versus right word- and face-selective regions. Latency of word (yellow) and face (blue) sensitivity onset, latency of peak sensitivity, and magnitude of peak sensitivity across hemispheres. Latency of sensitivity onset is defined as the first time point that reached a d′ corresponding to p < 0.001 nonparametrically defined by the prestimulus baseline period. All time points reference the leading edge of the classification window. Box plots represent median, 25th and 75th percentiles. Summary statistics of each box plot are presented in the table. n.s., Not significant, p > 0.05. *p < 0.05. **p < 0.01. ***p < 0.001.

