Figure 1.
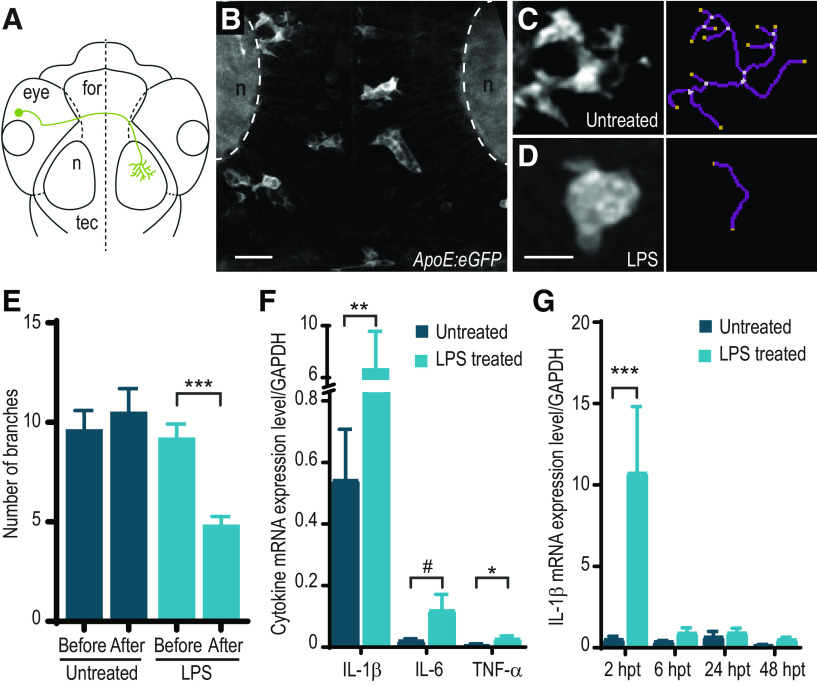
Treatment of zebrafish larvae with LPS causes microglial activation and increased cytokine expression. A, Schematic representation of an RGC in the zebrafish larval brain. for, forebrain; n, neuropil; tec, optic tectum. B, Microglia have a ramified morphology under normal conditions. Z-projection image of the tectum of a 3 dpf Tg(ApoE:GFP) zebrafish. C–E, Microglia exhibit morphologic changes in response to LPS. Morphology of microglia following control (C) and LPS treatment (D). Right, Skeletonized views. E, Quantification of number of branching ramifications per microglia in control and LPS-treated Tg(ApoE:GFP) larvae at 3 dpf. n = 53 cells from 4 animals (control); 91 cells from 7 animals (LPS). ***p < 0.001; two-way ANOVA with Sidak correction for multiple comparisons. F, Treatment of zebrafish larvae with LPS at 3 dpf causes an increase in mRNA levels of cytokines IL-1β, IL-6, and TNF-α measured by qRT-PCR. mRNA levels were assayed in WT larvae following a 2 h treatment with LPS at 3 dpf or in untreated controls (IL-1β: n = 6 untreated, n = 7 LPS-treated; IL-6: n = 4 untreated, n = 4 LPS-treated; TNF-α: n = 6 untreated, n = 6 LPS-treated). *p < 0.05; **p < 0.01; #p = 0.057; Mann–Whitney test. G, IL-1β cytokine mRNA levels measured by qRT-PCR. mRNA levels were assayed in WT larvae at 2 h post-treatment (hpt), 6, 24, and 48 hpt following a 2h treatment with LPS at 3 dpf or in untreated controls (2 hpt: n = 7 untreated, n = 9 LPS-treated; 6 hpt: n = 3 untreated, n = 3 LPS-treated; 24 hpt: n = 4 untreated, n = 4 LPS-treated; 48 hpt: n = 3 untreated, n = 3 LPS-treated). ***p < 0.001; Mann–Whitney test. Error bars indicate SEM. Scale bars, 10 µm.

