Figure 4.

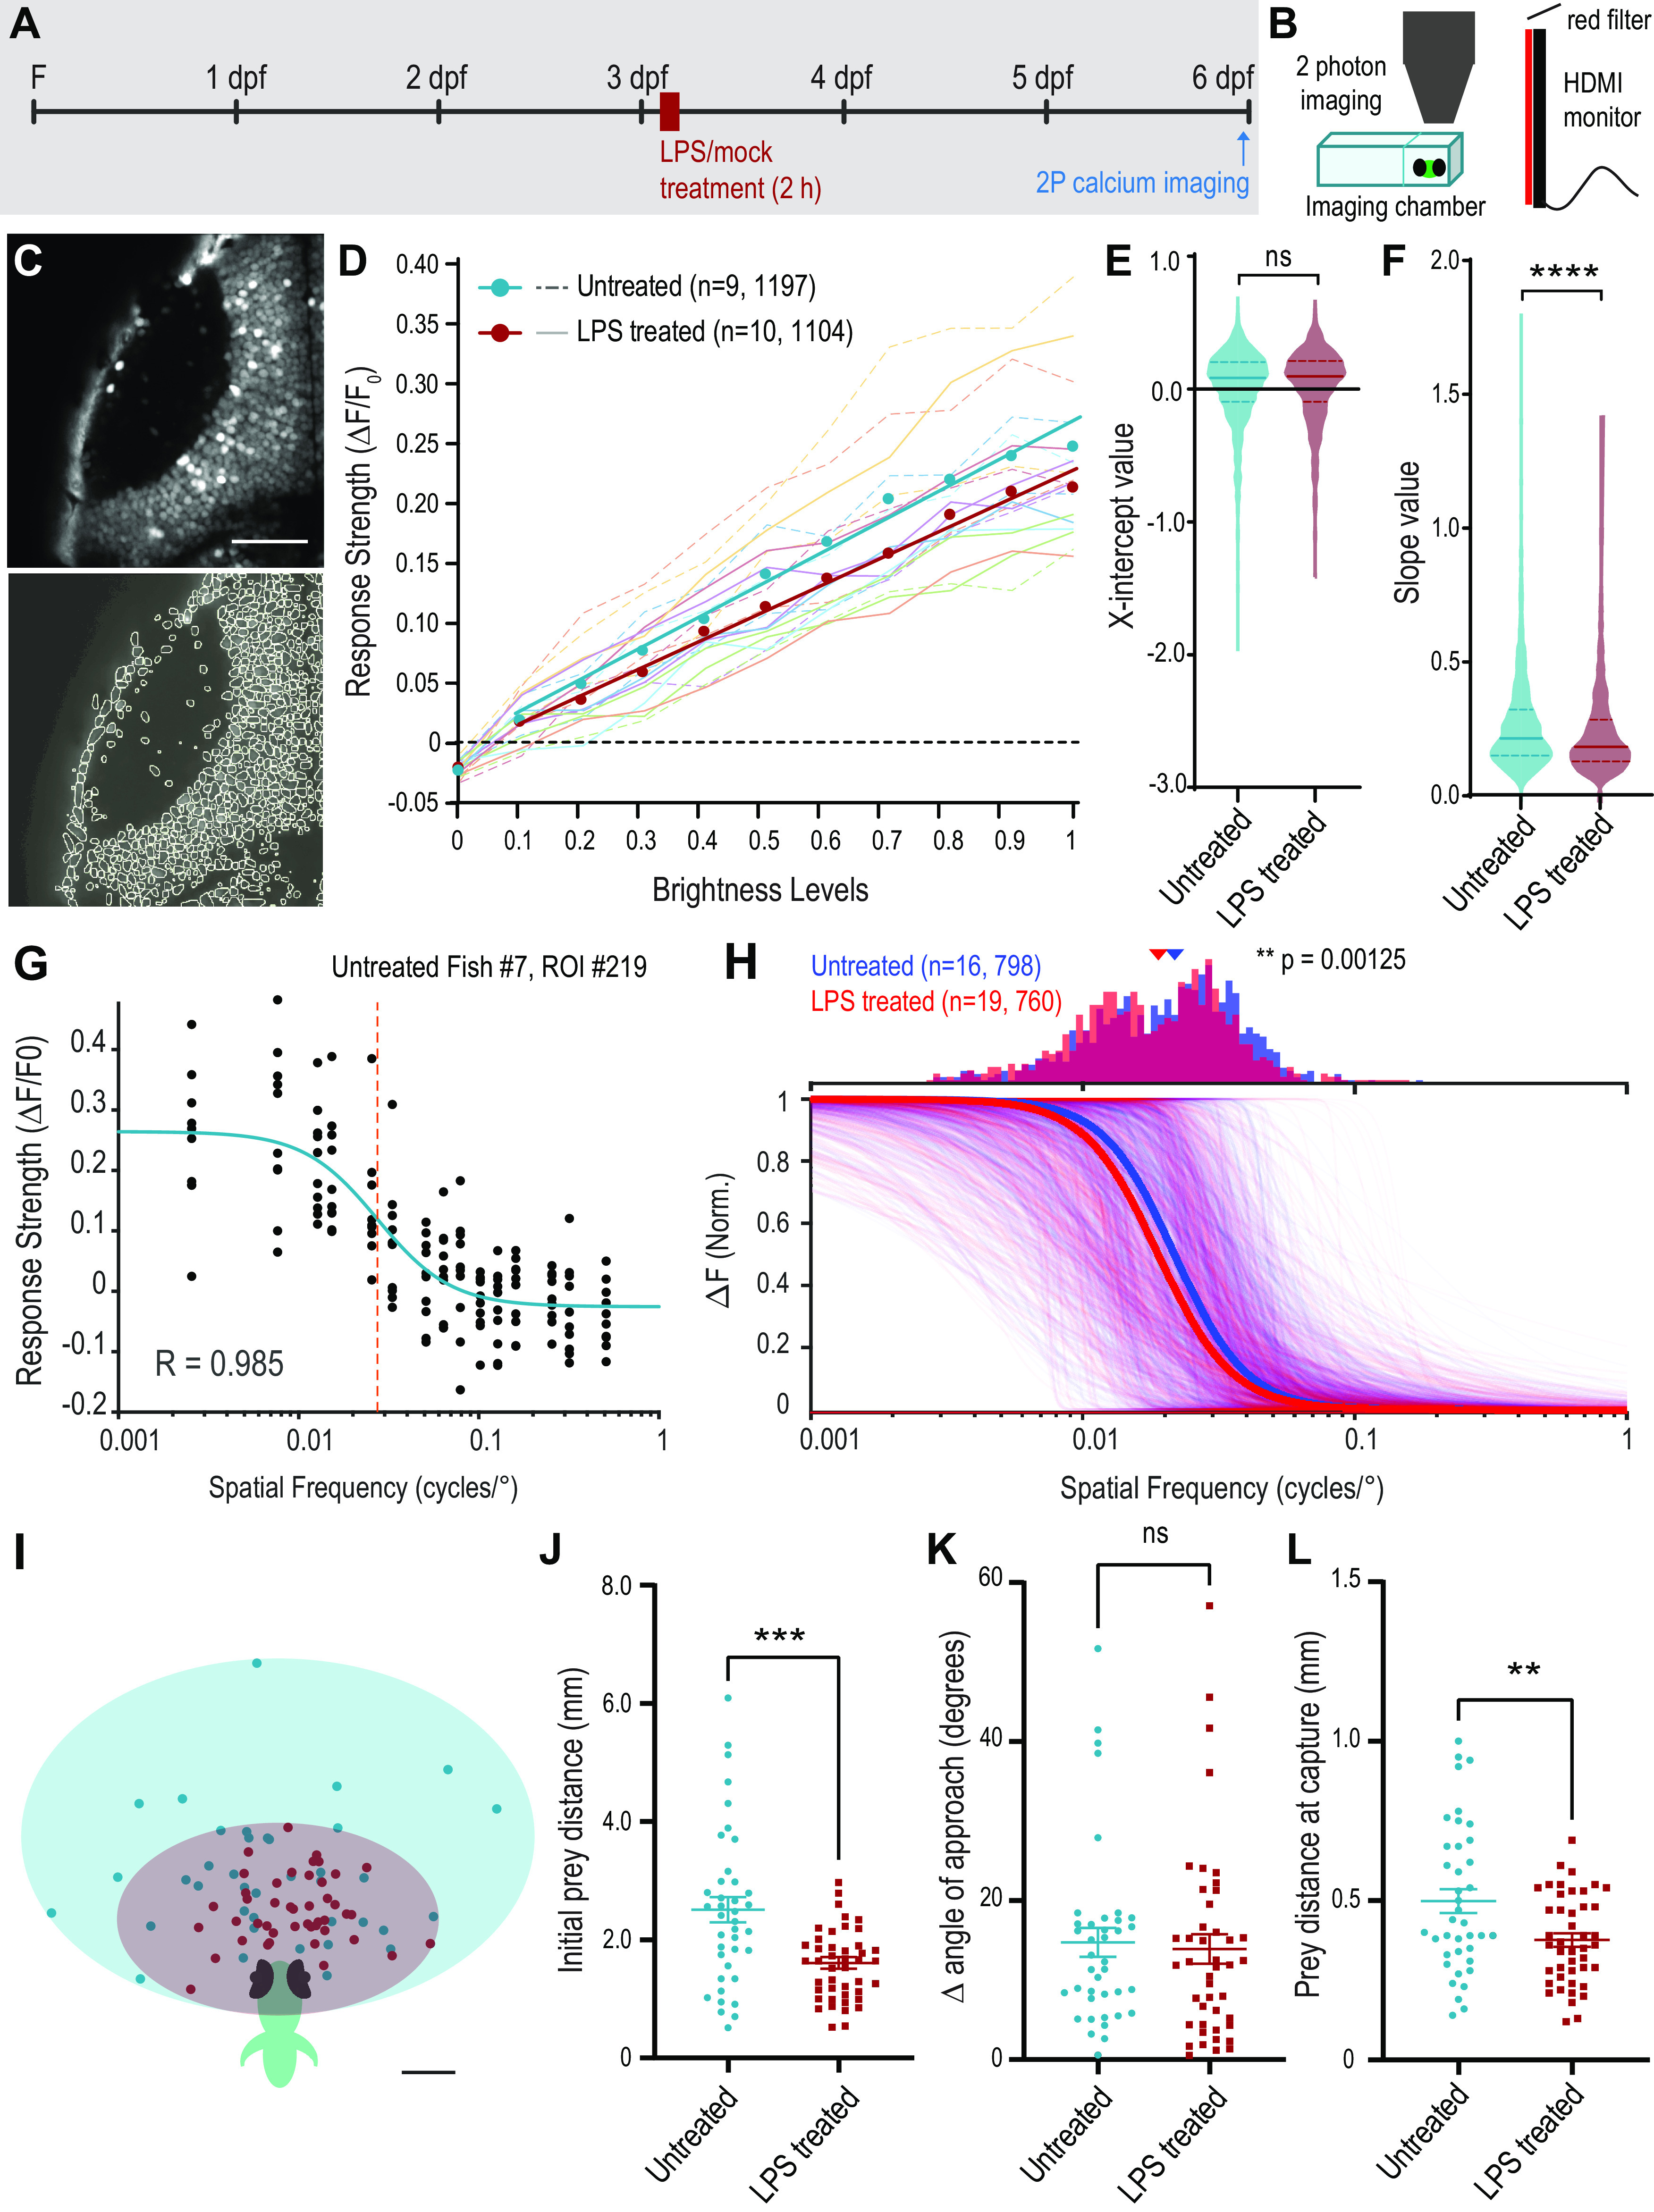
Functional consequences of inflammation on retinotectal circuit function. A, Experimental design: Tg(elav3:H2B-GCaMP6s) larvae were treated for 2 h with LPS or mock treatment control and imaged at 6 dpf. B, Experiment setup: larvae were embedded in low-melting point agarose in a custom chamber and placed in front of a monitor showing visual stimulation protocols. Calcium-induced changes in GCaMP6s fluorescence were recorded with a two-photon microscope. C, Example time-projected image from 1 z-plane of the left tectum of a Tg(elav3:H2B-GCaMP6s) larva with ROIs auto-identified for data extraction (bottom). D, Average response strength (ΔF/F0) of the significantly responding cells to full-field flash visual stimuli of increasing brightness levels for each larva. Average response strength (ΔF/F0) of the ROIs for individual fish are indicated by dashed lines (untreated) and full lines (LPS-treated). Circles with corresponding trendlines represent the average of all the ROIs. E,F, Comparison of linear regression values for x intercept (E) and slope (F; untreated n = 9 fish, 1197 total ROIs; LPS-treated n = 10 fish, 1104 total ROIs). ****p < 0.0001. G, Response strength of an example cell to each of 10 presentations of visual stimuli consisting of counterphasing sinusoidal gratings of varying spatial frequency. The data are fitted to a sigmoidal curve, and the spatial frequency value at which the cell generates a response of half-maximum strength (SF50) is extracted. H, Normalized sigmoidal response curves for all selected cells in untreated (blue, n = 16 fish, 798 total ROIs) and LPS-treated (red, n = 19 fish, 760 total ROIs) larvae, with average group response curves illustrated with thick lines of corresponding color. The distribution of the SF50 values for selected cells is shown in the histogram above. Arrowheads above the histogram represent a shift in the median value of the distribution. **p = 0.00125; Wilcoxon rank sum test. I, Representation of the position of paramecia at initiation of pursuit by untreated (green, n = 43 events, 6 larvae) and LPS-treated larvae (red, n = 47 events, 7 larvae). J–L, Comparisons of initial prey distance (J), difference between the prey angle and the angle of the initial turn (K), and the distance of the prey before the final swim bout at the time of capture (L). ***p < 0.001; **p < 0.01; Welch's t test. Error bars indicate SEM. Scale bars: C, 50 µm; I, 0.5 mm. F, Fertilization.
