Figure 5.

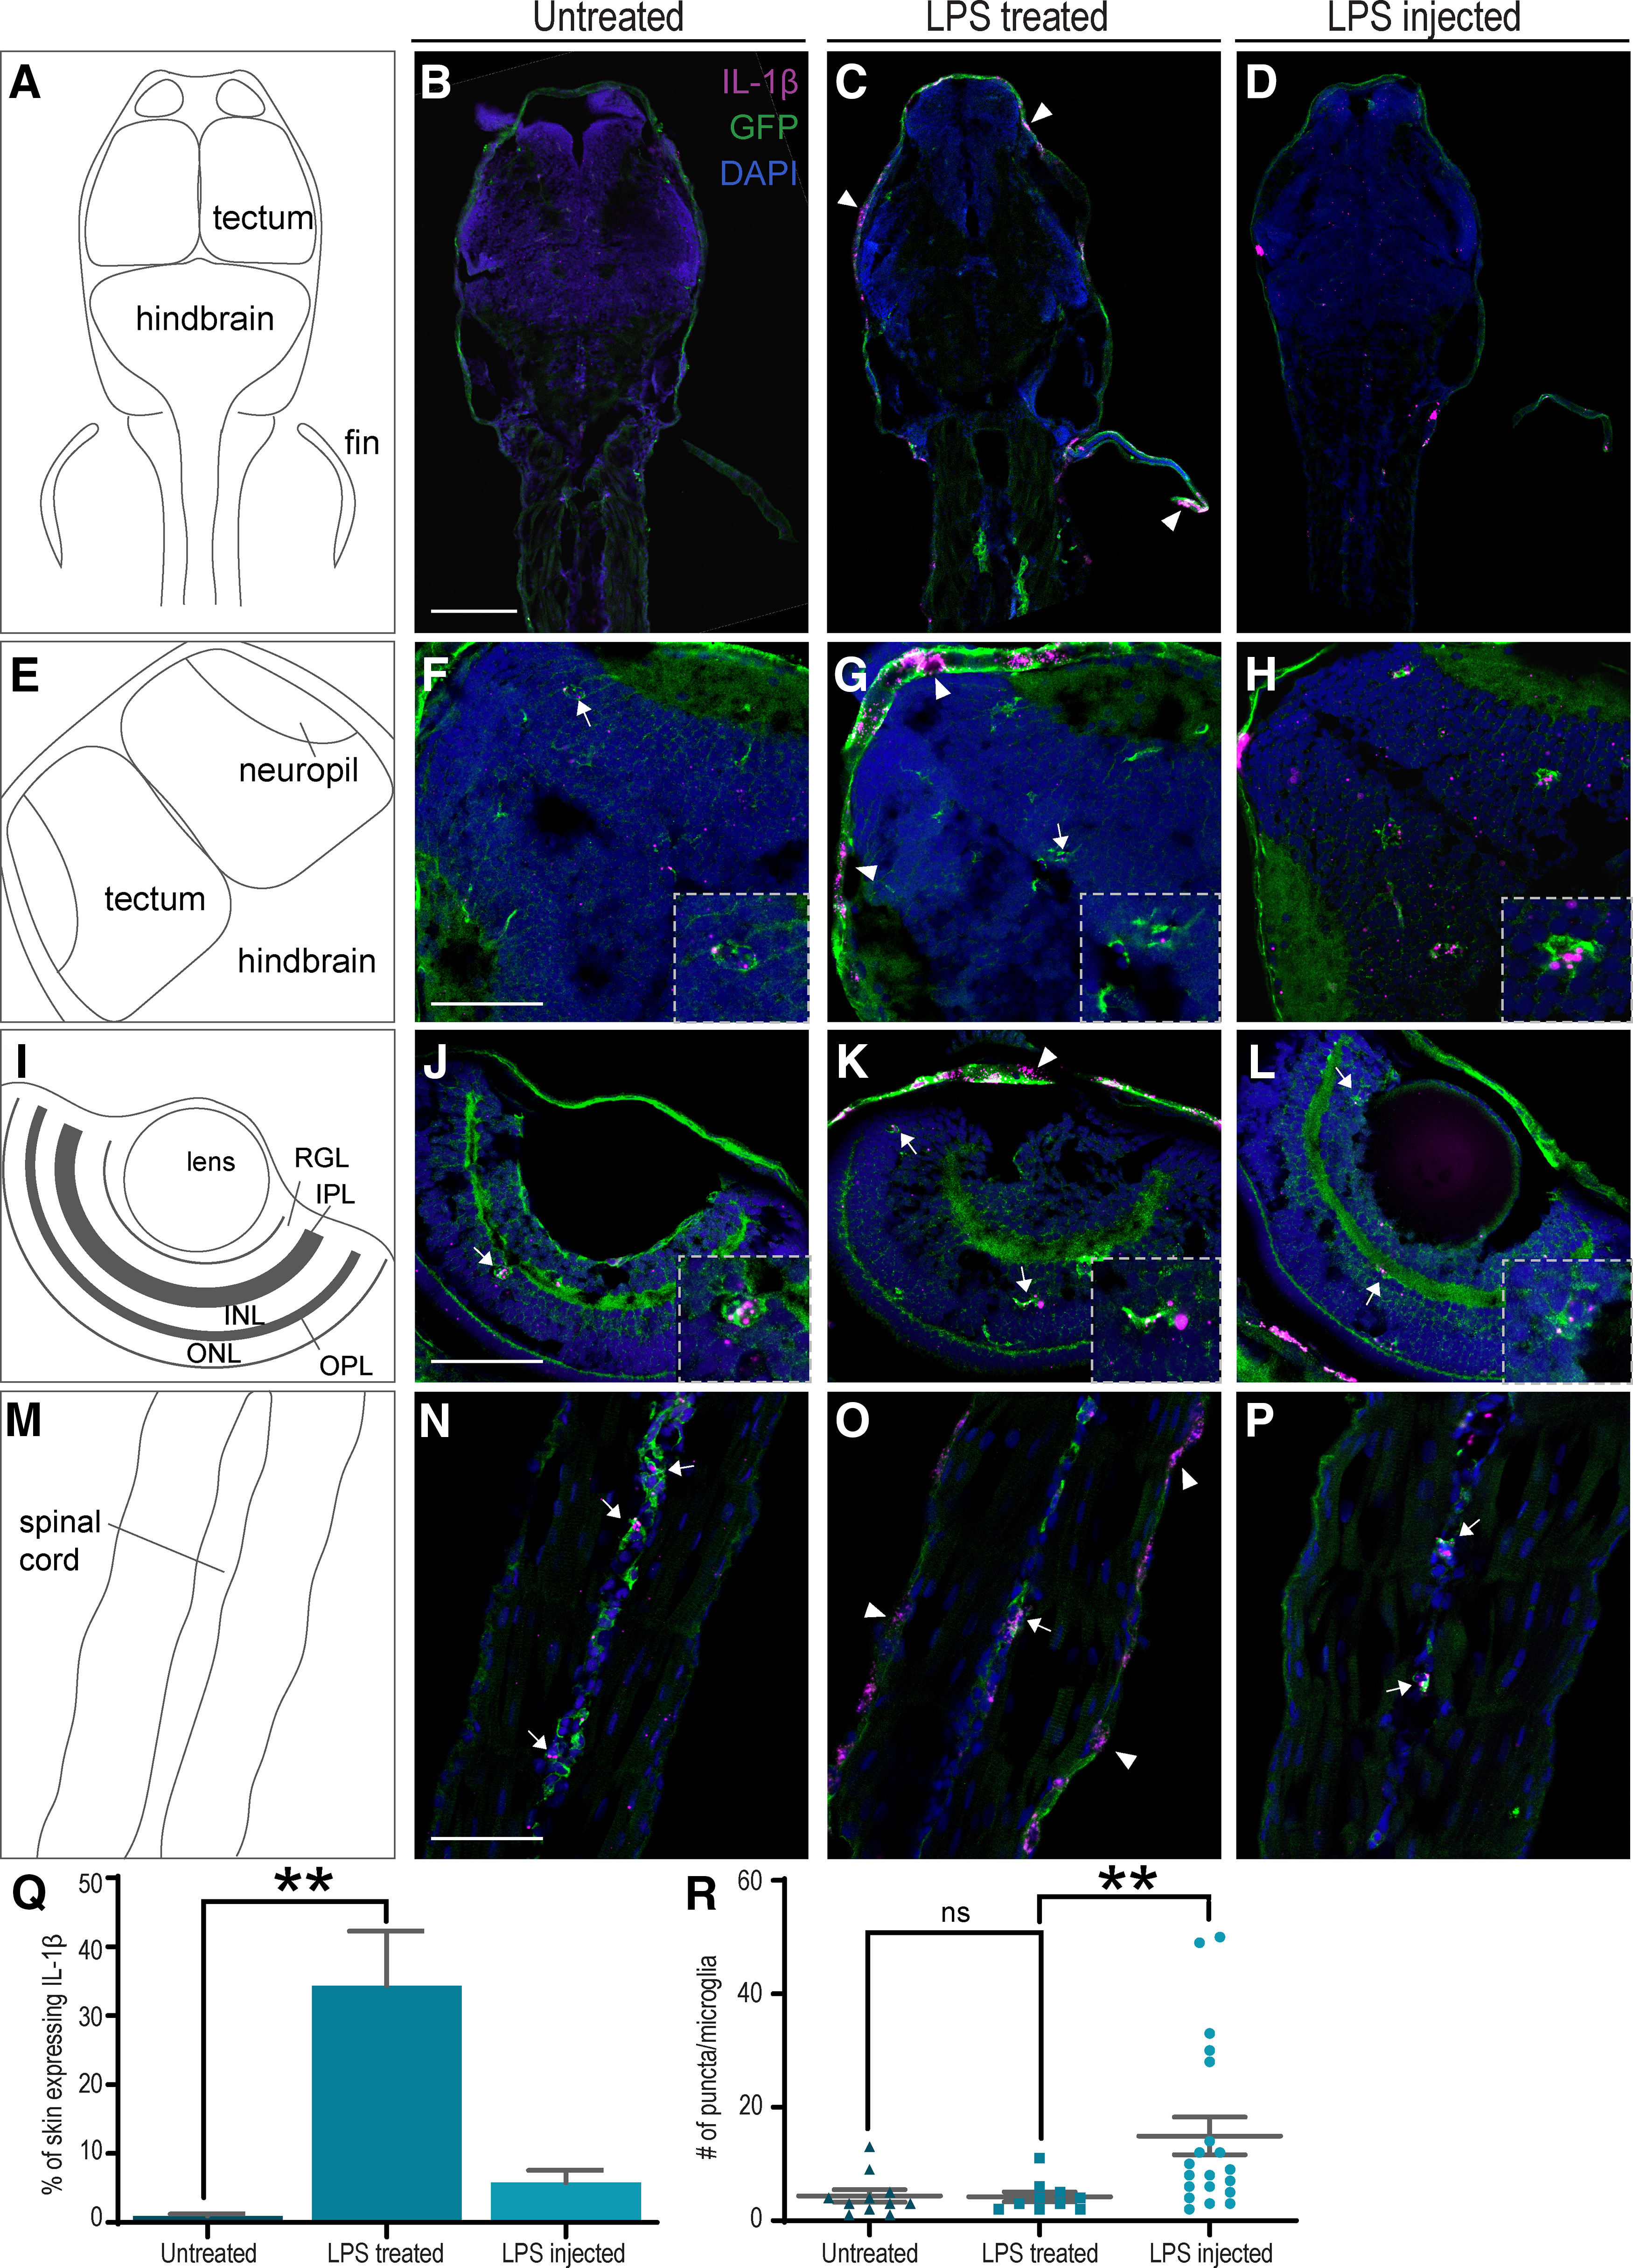
Expression of IL-1β in zebrafish larvae. A,E,I,M, Diagrams of the images shown to their right. B–D, Anterior half of untreated (B), LPS-treated (C), or LPS-injected (D) 3 dpf larvae. IL-1β expression is observed in the skin of LPS-treated larvae (arrowheads) 2 h after treatment. F–H, Expression of IL-1β is observed in microglia (arrows/insets) of untreated (F), LPS-treated (G), and LPS-injected (H) larvae. Expression in patches of skin is also observed in the LPS-treated (arrowhead, G) larvae. J–L, Microglia in the retina of all 3 larvae also express IL-1β. N–P, Microglia in the spinal cord of all 3 larvae express IL-1β. Magenta represents IL-1β (RNAscope). Green represents EGFP (immunohistochemistry). Blue represents DAPI nuclear staining. RGL,RGC layer; IPL, inner plexiform layer; INL, inner nuclear layer; OPL, outer plexiform layer; ONL, outer nuclear layer. Q,R, Quantification of the data represented in A–P. The percentage of skin that expresses IL-1β mRNA is significantly increased in LPS-treated larvae (Q; untreated n = 4, LPS-treated n = 3, LPS-injected n = 3). The number of IL-1β RNAscope puncta is significantly increased in microglia from LPS-injected larvae only (R; untreated: n = 11, LPS-treated: n = 10, LPS-injected: n = 20). **p < 0.01; Kruskal–Wallis test. Error bars indicate SEM. Scale bars: B–D, 100 µm; F–P, 50 µm.
