Figure 7.
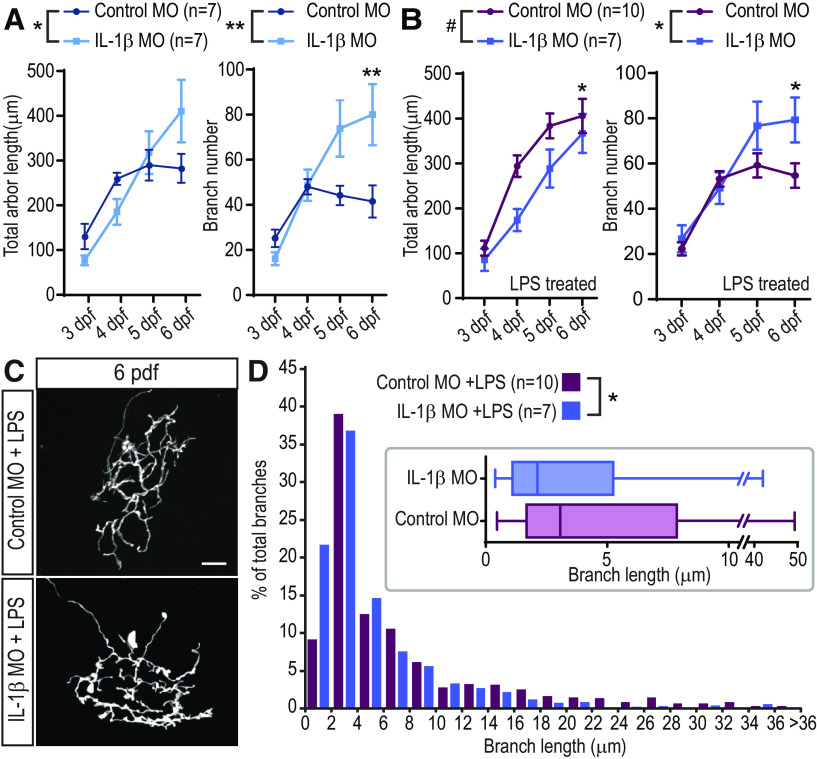
RGC arbors in IL-1β MO-injected animals have abnormal growth. A, In the absence of LPS treatment, RGC arbors in IL-1β MO-injected animals display a different growth curve than those from control MO animals. Cells from IL-1β MO-injected animals increase in size slower than control cells but continue to grow until 6 dpf, whereas arbor length of control MO cells plateaus at ∼5 dpf. Cells from IL-1β MO-injected animals add more branches than control MO cells, especially at 5 and 6 dpf. *p < 0.05; **p < 0.01; two-way repeated-measures ANOVA with Sidak correction for multiple comparisons. B, In the presence of LPS, cells from control MO and IL-1β MO-injected animals also have significantly different growth curves, both in total length and in the number of branches added. *p < 0.05; **p < 0.01; #p < 0.1; two-way repeated-measures ANOVA with Sidak correction for multiple comparisons. C,D, RGC arbors in IL-1β MO-injected animals have a greater number of very small branches at 6 dpf. The size distribution of all RGC branches from control MO and IL-1β MO-injected animals is significantly different, as measured at 6 dpf in LPS-treated animals, and illustrated in the inset in D). *p < 0.05; Wilcoxon test. Error bars indicate SEM. Scale bars, 25 µm.

