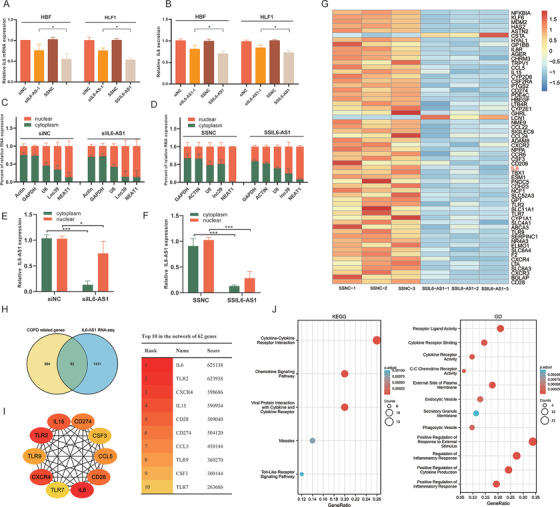
FIGURE 4.

Nuclear IL6‐AS1 regulates inflammation. (A and B) qRT‐PCR and ELISA analysis of the expression (A) and secretion (B) of interleukin (IL) 6 after transfection with SSIL6‐AS1 or siIL6‐AS1‐1 in HBF and HFL1 cells (one‐way ANOVA, n = 4 biological replicates). (C and D) Nuclear fractionation analysis and qRT‐PCR analysis of IL6‐AS1 expression in the nucleus and cytoplasm, respectively, after transfection with siIL6‐AS1‐1 (C) or SSIL6‐AS1 (D) (two‐way ANOVA, n = 3 biological replicates). (E and F) IL6‐AS1 RNA fold‐change in the nucleus and cytoplasm after transfection with siIL6‐AS1‐1 or SSIL6‐AS1 (n = 3 biological replicates). (G) Heatmap representing 62 genes that intersect between IL6‐AS1 RNA‐seq DEGs and COPD‐related genes. Rows represent genes and columns represent treated samples. Blue, downregulation; red, upregulation. (H) Intersection of the Venn diagram shows the overlapping genes between both comparisons DEGs in IL6‐AS1 RNA‐seq and COPD‐related genes. (I) Schematic representation of the top 10 genes in the PPI network of 62 genes. The higher the score, the more important the gene. (J) Schematic representation of the KEGG and GO analysis of 62 genes. Error bars represent means ± SD. *p < 0.05 and ***p < 0.001
