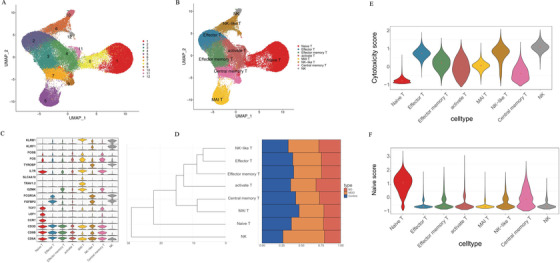
FIGURE 1.

Single‐cell transcriptomes of CD8 + cells from BD, MDD, and controls. (A) A UMAP map of CD8+ cells from BD (n = 4), MDD (n = 4), and Control (n = 4). Cells are colored by 1–12 clusters. (B) A UMAP map of CD8+ cells from BD, MDD, and Control, and Cells are colored by cell types. (C) Violin plot showing expression comparison of marker genes in different cell types. (D) Cluster dendrogram shows clustering among cell types, and the bar plot shows cell fraction from BD, MDD, and Control in each cell type. (E and F) The naiveness score and cytotoxicity score of each cell type
