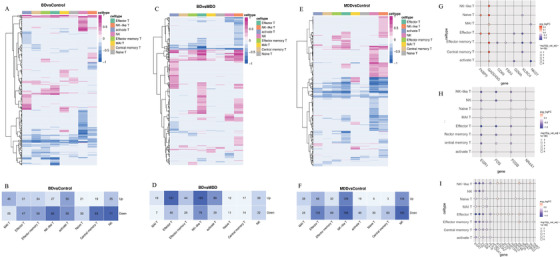
FIGURE 2.

Differentially expressed genes between cells in clusters from BD, MDD, and controls. (A and B) Heatmap showing numbers of differentially expressed genes between BD and Control in each cell type. (C and D) Heatmap showing numbers of differentially expressed genes between MDD and Control in each cell type. (E and F) Heatmap showing numbers of differentially expressed genes between BD and MDD in each cell type. Red means genes upregulated, and blue denotes upregulated in the heatmap. Only the genes which absolute value of log fold change ≥ 0.25 and adjusted p value < 0.05 are marked with differentially expressed genes. (G) Changes of seven genes in each cell type which overlapped with BD susceptibility genes in previous studies, 6 Red means upregulated, and blue means downregulated in BD. (H) Changes of four genes which were overlapped with MDD risk genes in an RNA‐seq study. 7 Red means upregulated, and blue means downregulated in MDD. (I) Seventeen genes which were overlapped with a meta‐analyzed data from the largest genome‐wide association studies of depression. 8 Red means upregulated, and blue means downregulated in MDD. Differentially expressed genes, see also Table S4
