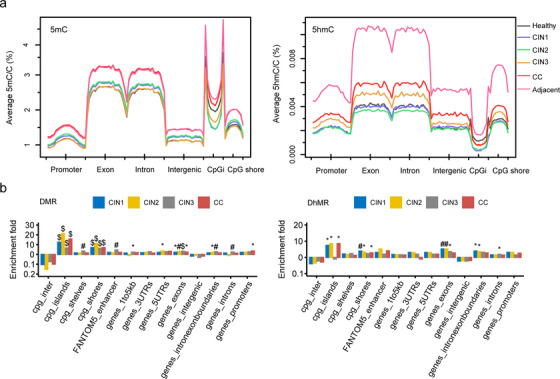
FIGURE 2.

Genomic features relative density of 5mC (A, left) and 5hmC (A, right) within function genomic regions in hg19. CpGi, CpG island. The enrichment fold in each functional region was determined by the ratio of random simulated regions to the DMR (B, left) or DhMR (B, right) within the regions and the DMR/DhMR without the regions. p values were calculated by hypergeometric's test. Cpg_inter, cpg intergenic region. (*p < 0.05, #p < 0.01, $p < 0.001)
