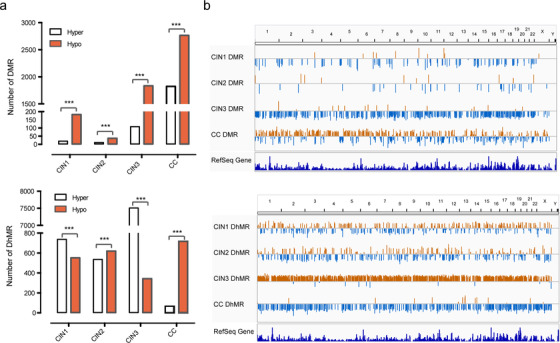
FIGURE 3.

Genome‐wide DMRs and DhMRs in CINs and CC. (A) Number of regions of DMRs (up) and DhMRs (down) occur in CINs and CC. Regions that gain a mark (“hyper‐”) are represented by white bars, whereas losses (“hypo‐”) are marked by red. (B) Chromosomal distribution of significant DMRs (up) and DhMRs (down) compared with the healthy. The length of the line represents the level of methylation difference. Upward orange lines are hypermethylated regions, and downward blue lines are hypomethylated regions. (*p < 0.05, **p < 0.01, and ****p < 0.0001)
