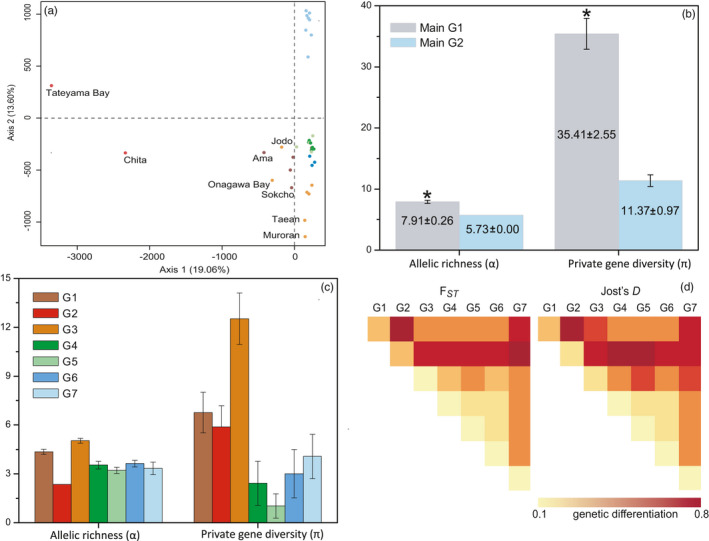
FIGURE 2.

(a) Genetic differentiation inferred by factorial correspondence analysis (FCA) of population multiscores. Standardized allelic richness and private diversity (number of unique alleles) for the first (b) and second (c) hierarchical level of genetic subdivisions. Colours refer to the same assignment of genetic clusters in Figure 1. Asterisks refer to significant higher levels of diversity. (d) The genetic differentiation matrix of average F ST and Jost's D between 7 subdivided clusters
