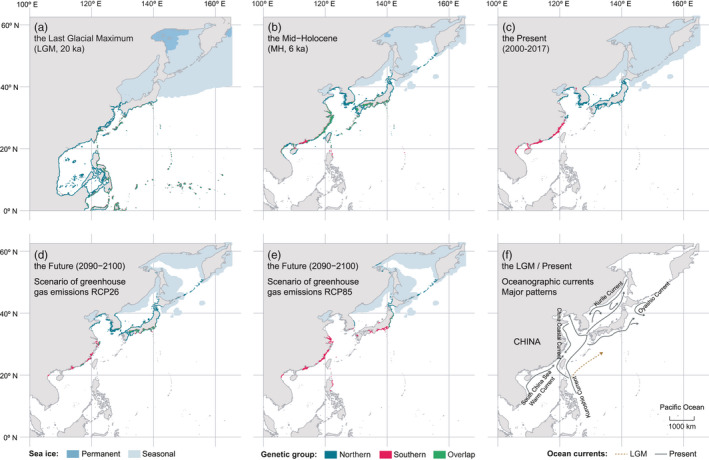
FIGURE 3.

Ensemble distribution maps of Sargassum thunbergii for the Last Glacial Maximum (LGM) (a), the mid‐Holocene (MH) (b), the present (c) and the future (2090–2100) (d and e), and major oceanographic currents during the LGM and present‐day conditions (f) (drawn after Hu et al., 2011). The future distribution considered contrasting scenarios of greenhouse gas emissions of RCP26 (d) and RCP85 (e). Predictions were performed with the ensemble of models considering genetic structure. Light blue polygons depict seasonal sea ice and grey polygons depict land area
