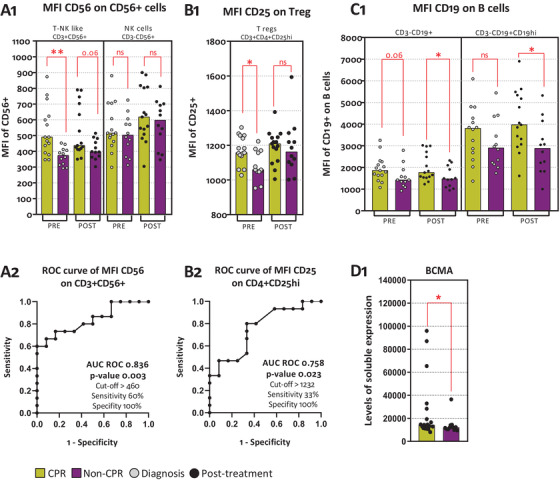
FIGURE 3.

Immunophenotyping associated to pathological response. (A1) MFI of CD56+ cells on T‐NK like (CD3+CD56+) cells and NK cells (CD3–CD56+). (A2) AUC ROC curve of CD56 MFI on CD3+CD56+. (B1) MFI of CD25 on CD3+CD4+CD25hi. (B2) AUC ROC curve of CD25 MFI on CD3+CD4+CD25hi. (C1) MFI of CD19 on CD3–CD19+ and CD3–CD19hi. (D1) BCMA levels of expression. Legend: Diagnosis (PRE, grey dots), prior to surgery (POST, black dots), CPR patients (yellow bars), and non‐CPR patients (purple bar). Nonparametric Mann–Whitney test was used for comparisons (ns, not significant; *p‐value <.05; **p‐value <.01; ***p‐value <.001) and receiver operating characteristic (ROC) curve analysis showing AUC ROC curve, p‐value, and optimum cut‐off
