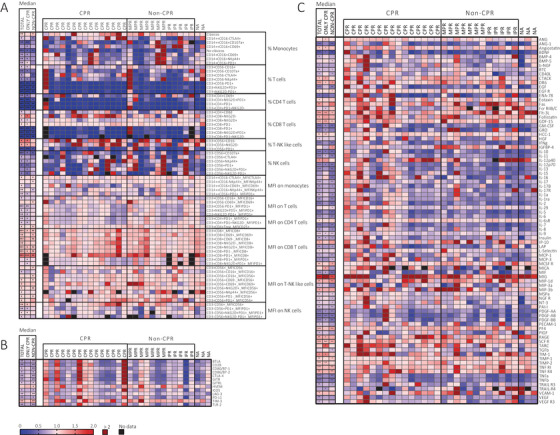
FIGURE 5.

Neoadjuvant treatment influence on immune cells and plasma factors. (A) Percentage of immune cells from peripheral blood and MFI on immune cells from peripheral blood. (B) Soluble factors secretion in plasma. (C) Cytokine secretion on plasma. Legend: Fold‐change (POST/PRE) from 0 to 2, 0 indicating (blue) a decrease after treatment, 1 (pink) indicates no changes, 2 (red) indicates increase, and >2 (dark red) indicates more than double of increase, and black squares (no data). Nonparametric Wilcoxon test was used for comparisons, (empty, not significant; *p‐value <.05; **p‐value <.01; ***p‐value <.001)
