FIGURE 2.

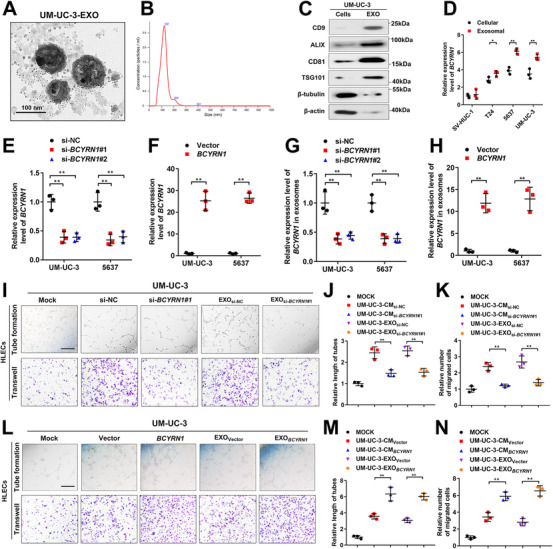
Exosomal BCYRN1 promotes the lymphangiogenesis of BCa in vitro. (A and B) The characteristics of exosomes isolated from UM‐UC‐3 cells culture media were identified by TEM and NTA. Scale bars: 100 nm. (C) Western blotting analysis of the indicated exosomal markers in the UM‐UC‐3 cell lysate and purified exosomes from the culture media. (D) qRT‐PCR analysis of BCYRN1 expression in SVHUC‐1 and BCa cell lines (T24, UM‐UC‐3, 5637) and their corresponding exosomes isolated from the culture media. (E and F) qRT‐PCR analysis of BCYRN1 expression in UM‐UC‐3 and 5637 cells after silencing or overexpressing BCYRN1. (G and H) qRT‐PCR analysis of BCYRN1 levels in exosomes isolated from BCYRN1‐silenced or overexpressing UM‐UC‐3 and 5637 cells culture media. (I‐K) Representative images and quantification of tube formation and Transwell migration for HLECs treated with PBS, culture media from UM‐UC‐3si‐NC or UM‐UC‐3si‐ BCYRN1 #1 cells, and their corresponding exosomes. Scale bars: 100 μm. (L‐N) Representative images and quantification of tube formation and Transwell migration for HLECs treated with PBS, culture media from UM‐UC‐3Vector or UM‐UC‐3 BCYRN1 cells, and their corresponding exosomes. Scale bars: 100 μm. The statistical difference was assessed through one‐way ANOVA followed by Dunnett's tests in D, E, G, J, K, M, and N; and two‐tailed Student's t test in F and H. Error bars show the standard deviations derived from three independent experiments. *p < 0.05; **p < 0.01
