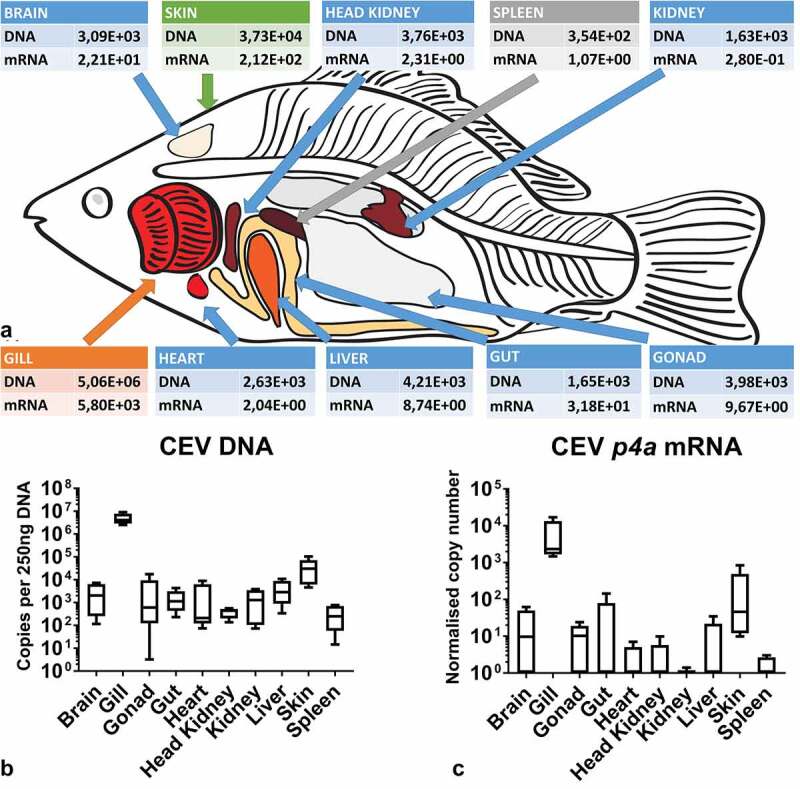
Figure 1.

(a) Mean virus load and expression of transcripts encoding the viral P4a capsid core protein in a tissue library of KSD-affected fish showing that gills are the main target organ for the virus. Colors indicate different levels of virus load: orange 107 copies – 105 copies, green 105 copies - 104 copies, blue 104 copies – 103 copies, grey <103. (b) Box plot diagrams presenting 25%–75% (±minimum and maximum values) percentiles and the median as a horizontal line of the virus load in analyzed carp tissues. Depicted is the copy number of viral genome per 250 ng of isolated DNA from n = 5 specimen. (c) Box plot diagrams presenting 25%–75% (±minimum and maximum values) percentiles and the median as a horizontal line of data on the expression of mRNA encoding the viral P4a capsid core protein in normalized copy numbers in analyzed tissues from n = 5 specimen
