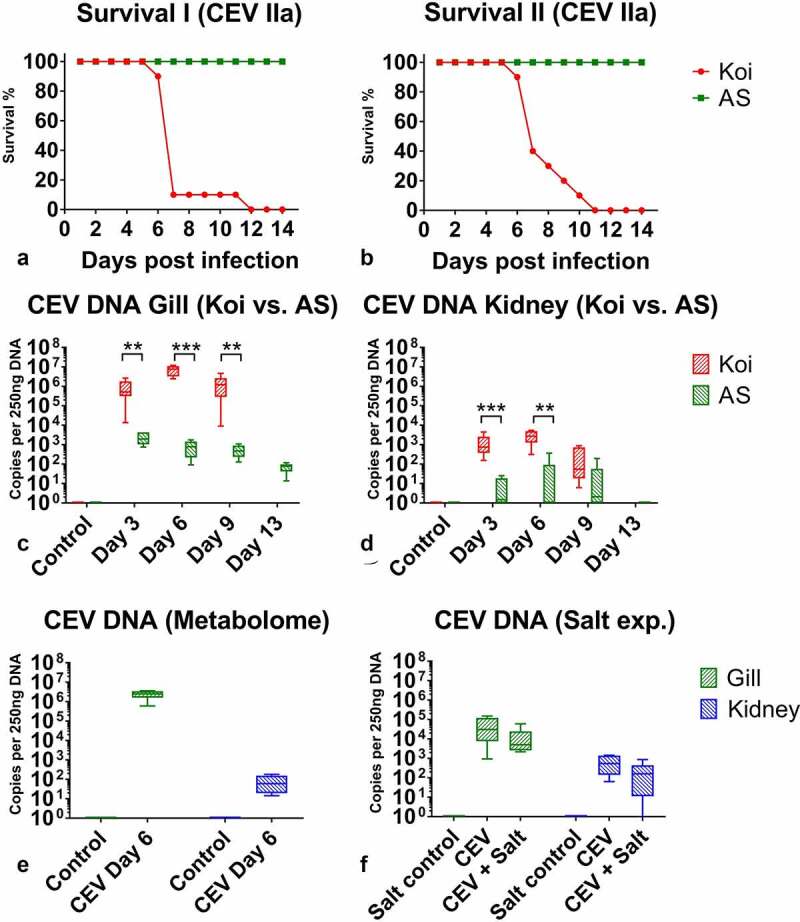
Figure 2.

Kinetics of an infection of koi and AS carp with carp edema virus from genogroup IIa during different experiments. (a) and (b) Approximated mortality curves based on the number of animals removed from the experiment when they reached the clinical signs score qualifying for the humane end-point of the experiments. All animals removed presented severe sleepiness or CLB when they were not responding to external stimuli. (c) and (d) CEV loads in gills and kidney of specimen from the koi and AS strains, which show extremely different levels of susceptibility to the infection. Koi were highly susceptible, while AS were highly resistant to the CEV infection and development of KSD leading to mortality. (e) Virus load in the gills and kidney of fish used in the metabolome study. (f) Virus load in the gills and kidney of fish in the salt treatment study. Significant differences between koi and AS are marked with * at p ≤ 0.05, with ** at p ≤ 0.01, with *** at p ≤ 0.001. Mortality data are presented as percentage curves of fish remaining in the experiment. Virus load data are presented as box plots of 25% – 75% percentiles (± minimum and maximum values) with an indication of median as a horizontal line
