Figure 8.

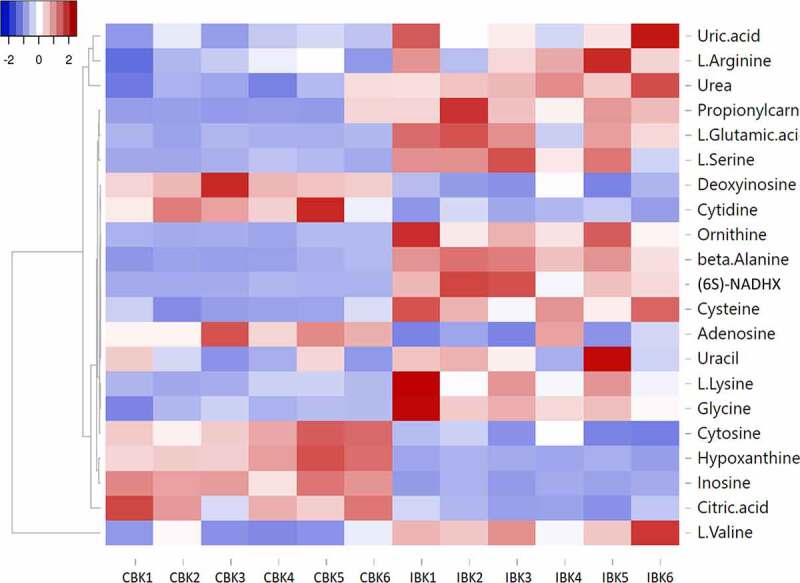
Heat map showing the change in the level of selected metabolites during CEV infection. IBK1-6 indicates plasma from CEV-infected koi, CBK1-6 indicates plasma from koi before infection

Heat map showing the change in the level of selected metabolites during CEV infection. IBK1-6 indicates plasma from CEV-infected koi, CBK1-6 indicates plasma from koi before infection