
Figure 9.
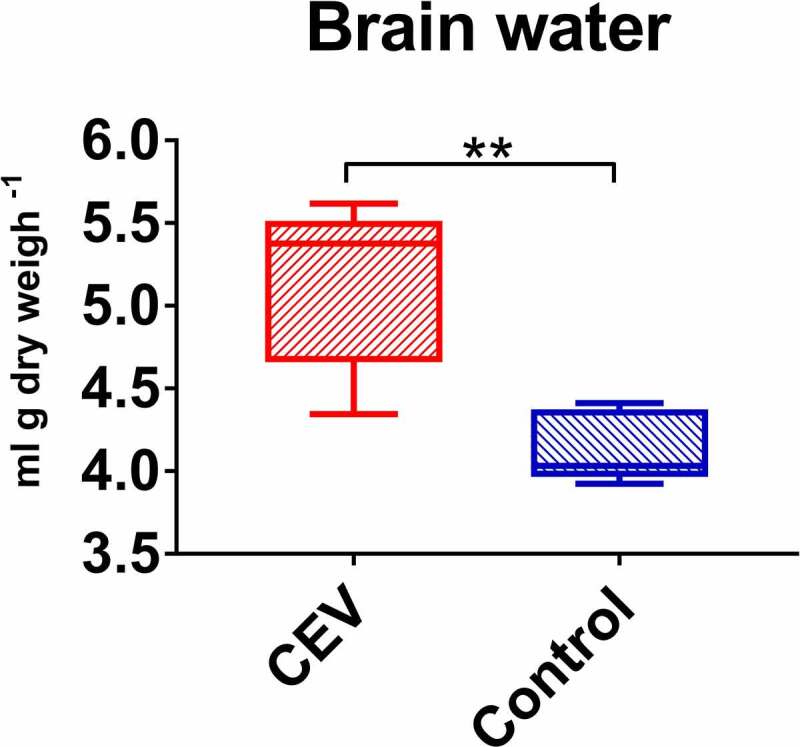
Accumulation of water in the brain of CEV-infected fish. Amount of water in brain per g dry weight is presented as box plots of 25% – 75% percentiles (±minimum and maximum values) with an indication of median as a horizontal line of measurements from n = 5 specimen. The analysis was performed with t-test. Significant differences between the control and infected are marked with * at p ≤ 0.05, with ** at p ≤ 0.0 1, with *** at p ≤ 0.001