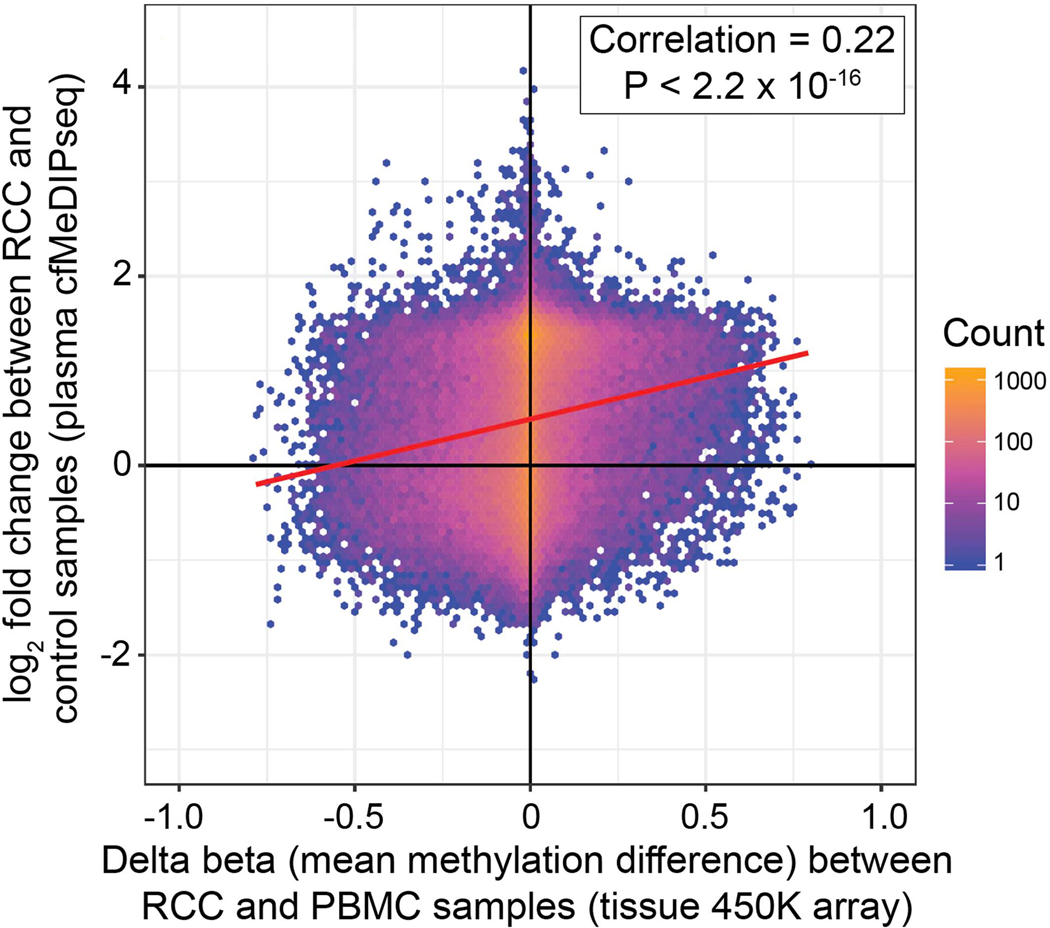
Extended Data Fig. 3. Correlation of differential methylation in plasma cfDNA and tumor DNA.
Density plot showing the overlap of plasma cfMeDIP-seq DMRs between 69 RCC and 13 control samples with differentially methylated CpGs in tissue from 450K methylation arrays between 93 peripheral blood mononuclear cell and 324 RCC tumor samples. Each observation (n=102,852) represents a 450K methylation array probe (x-axis) that overlaps a region covered by the cfMeDIP-seq assay (y-axis) where the color of each hex bin corresponds to the number of observations in that bin. A simple linear regression line is shown in red. The spearman rank correlation was computed and a 2-sided hypothesis of whether this correlation is equal to zero was carried out.

