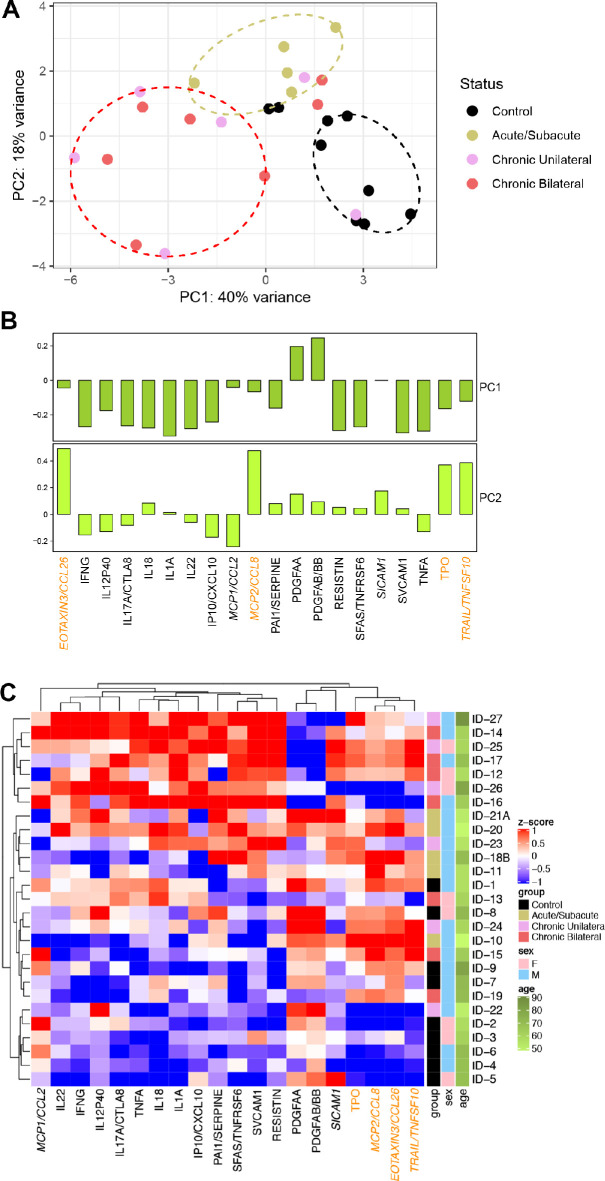
Figure 2.
Potential biomarkers have a segregated distribution in controls and NAION subjects. (A) Principal component analysis (PCA) of the log-transformed levels of the 20 molecules in the biomarker candidate list. Individuals are organized into three distinguishable clusters separating controls (black ellipse), acute (khaki ellipse), and chronic (red ellipse) NAION, with some overlap. (B) PC1 and PC2 loadings. The 5 proteins that are only in the acute NAION list are italicized, and those with higher loadings in PC2 are in orange font; chronic NAION molecules have higher loadings in PC1. (C) Hierarchical clustering generally ordered the individuals from controls at the bottom to acute in the middle to chronic at the top, with some overlap.

