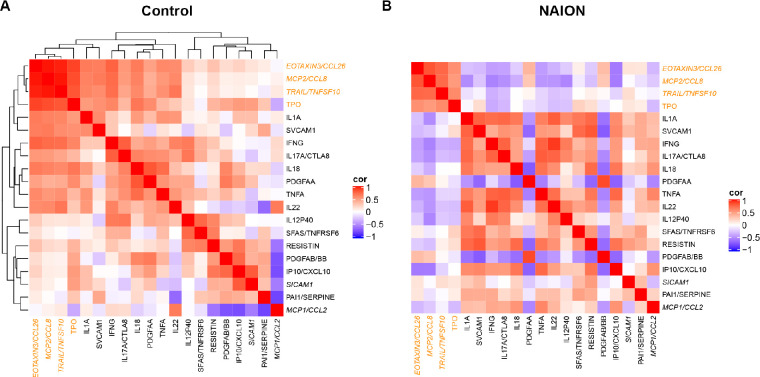
Figure 3.
Spearman correlation matrix of the biomarker candidate list for control and NAION. Differential patterns for control (A) and NAION (B). To simplify comparison, NAION heatmap has the same molecule ordering determined by clustering in the control. The 5 proteins that are only in the acute NAION list are italicized, and those with higher loadings in PC2 are in orange font.

