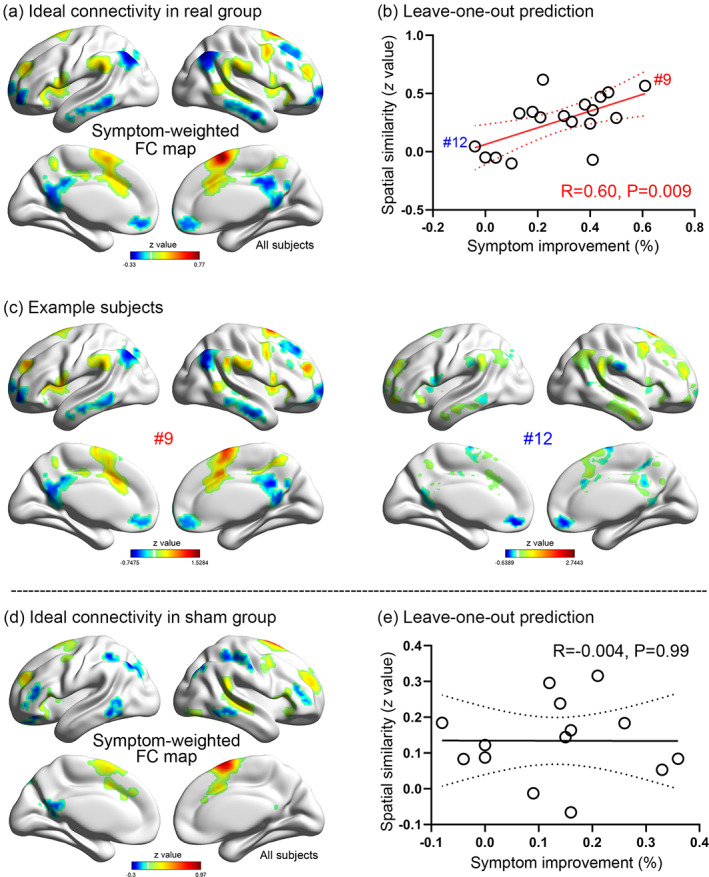
FIGURE 2.

Primary outcome prediction. An “ideal target network” identified by averaging the symptom‐weighted target connectivity map across patients (a). The pattern showing significantly positive connectivity in regions of ventral attention network, such as supramarginal lobule, anterior insular, and cingulate sulcus. Leave‐one‐out analysis indicating that the Yale–Brown Obsessive Compulsive Scale (YBOCS) improvement predicted by target connectivity map is positively correlated with the real improvement (b). The baseline connectivity pattern of Patients #9 and #12 are shown as examples for responders and nonresponders, respectively (c). An “ideal target network” pattern was also computed for the sham group (d), although no predictive value was found (e). Only voxels with absolute z value >0.14 are shown in the connectivity maps
