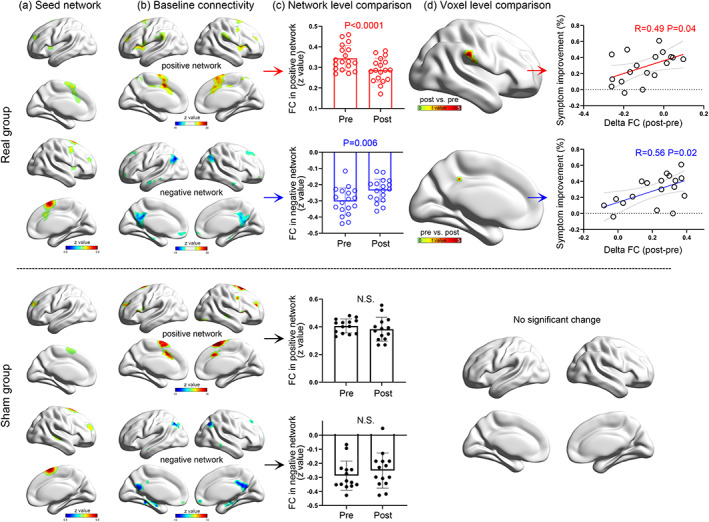
FIGURE 3.

Connectivity change of the ideal target network. The ideal target network showing different spatial patterns between groups (a). We took voxels positively or negatively correlating with the seed network at baseline (b) as two regions‐of‐interest. Their connectivity strength to the seed network significantly decreased in the real group but not in the sham group (c). Voxel‐wise comparison between pretreatment and posttreatment conditions showing significant connectivity strength decreases in the posterior cingulate cortex and supramarginal gyrus in the real group (d). No significant region was found in the sham group. Positive imaging‐symptom correlation showing a more prominent connectivity change predicting better symptom improvement (D)
