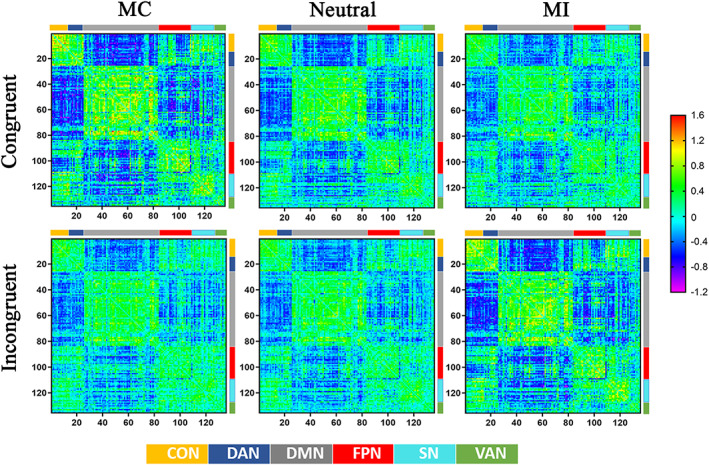
FIGURE 3.

Brain connectivity changes across the six conditions. The colored elements in the matrices indicate the connectivity values, as indicated by the rainbow‐colored bar to the right. The smaller color bars on the top and right sides of each matrix represent the six functional brain networks: (1) cingulo‐opercular, (2) dorsal attention, (3) default mode, (4) fronto‐parietal, (5) salience, and (6) ventral attention
