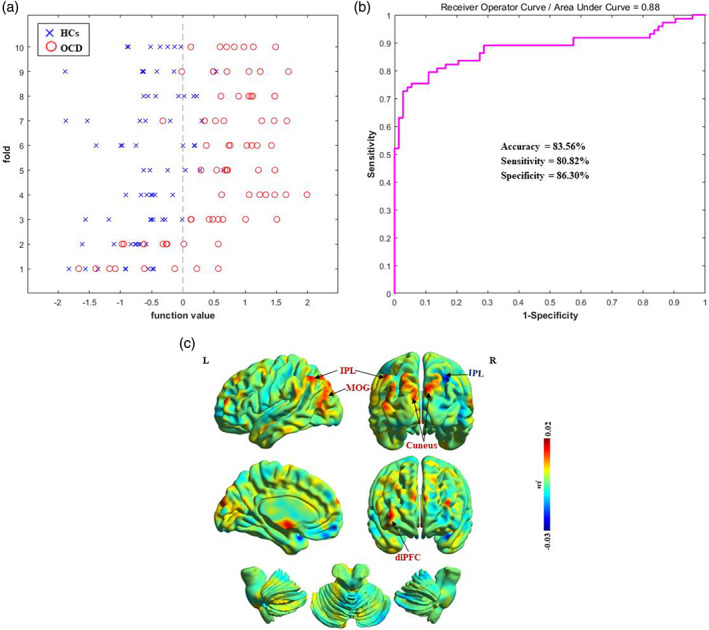
FIGURE 2.

Classification performance for OCD patients and HCs. (a) Classification plots for the SVM classifier. (b) ROC curves assessing SVM performance. (c) Discrimination weight map using dALFF. The color bar indicates the weighted vector value determined from SVM. dALFF, dynamic amplitude of low‐frequency fluctuation; dlPFC, dorsolateral prefrontal cortex; HCs, healthy control subjects; IPL, inferior parietal lobule; MOG, middle occipital gyrus; OCD, obsessive–compulsive disorder; ROC, receiver operating characteristic; SVM, support vector machine
