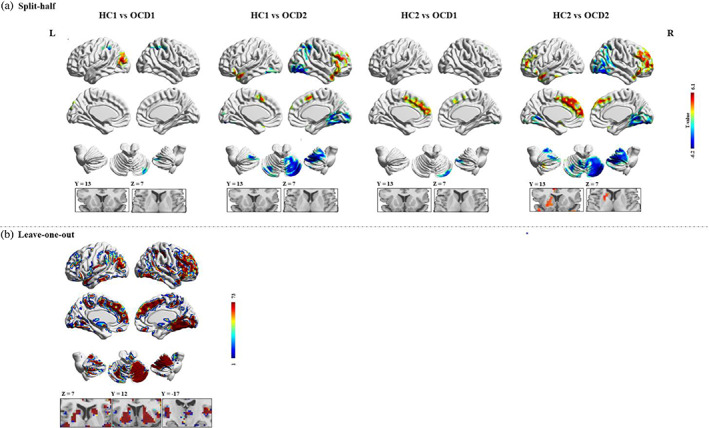
FIGURE 3.

Reproducibility of dynamic amplitude of low‐frequency fluctuation (dALFF) findings. (a) Split‐half sample validation. For each voxel, the color indicates T scores of group comparison. (b) Leave‐one‐out sample validation. For each voxel, the color indicates the number of tests where this voxel exhibited significant group differences across the 73 tests
