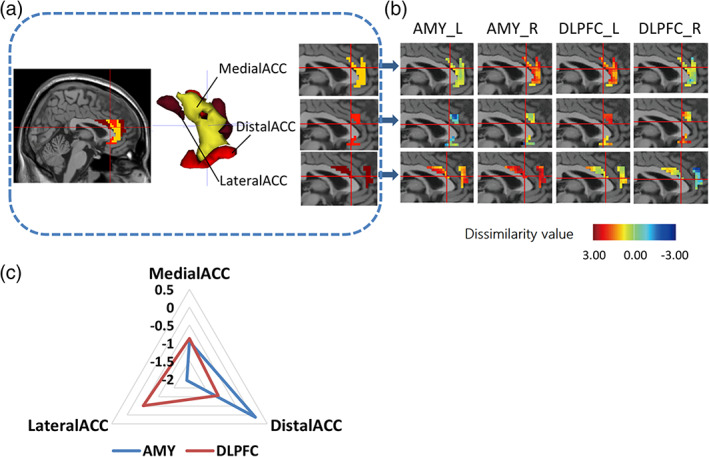
FIGURE 3.

Visualization of anterior cingulate cortex (ACC) subdivisions and impairment functional profile across subdivisions. (a) Three ACC subdivisions were mapped back on brain which located in medial, distal, and lateral portion separately. Yellow: MedialACC, Red: DistalACC, Brown: LateralACC. (b) ACC subdivisions and their impaired functional pattern in relation to left/right amygdala and dorsolateral prefrontal cortex (DLPFC), illustrated via the dissimilarity value distribution over voxels after the comparison of healthy controls with pretreatment patients. (c) Radar map of dissimilarity value in each subdivisions. The values of ACC subdivisions were averaged in relation to their connectivities to amygdala (AMY) or DLPFC
