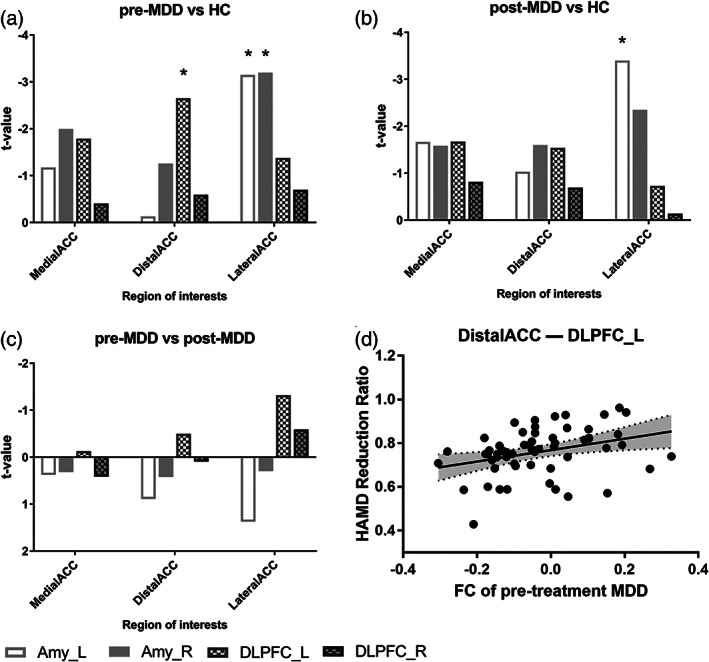
FIGURE 4.

Impairment pattern and recovery pattern in subdivisions. (a) Histogram of t values compared between major depressive disorder (MDD) patients before treatment and healthy controls (HCs) shows impairment pattern across subdivisions. (b) Histogram of t values compared between MDD after treatment and HC across subdivisions shows recovery pattern. (c) Histogram of t values between MDD before and after treatment. *: significant after false‐discovery rate (FDR) correction for multiple comparisons. (d) Prediction effect of functional connectivity (FC) between DistalACC and left dorsolateral prefrontal cortex (DLPFC_L). Each regression line depicts the predicted model for Hamilton Depression Rating Scale (HAMD) reduction ratio and FC between DistalACC and left DLPFC. Confidence intervals are plotted in dotted black lines and filled with gray color
