
FIGURE 5.
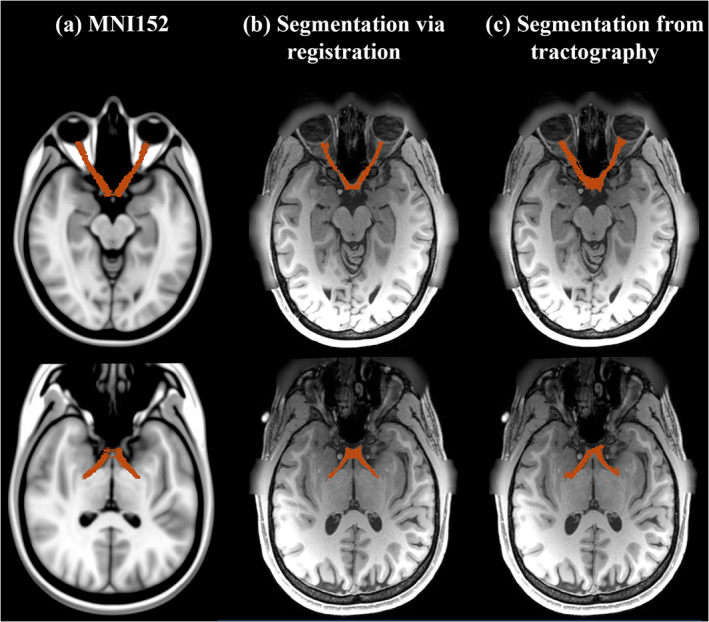
Visualization of RGVP segmentations. (a) shows the expert RGVP segmentation in MNI space; (b) shows a subject's RGVP segmentation, which was warped from the RGVP segmentation in MNI space. (c) shows a RGVP segmentation computed from tractography results