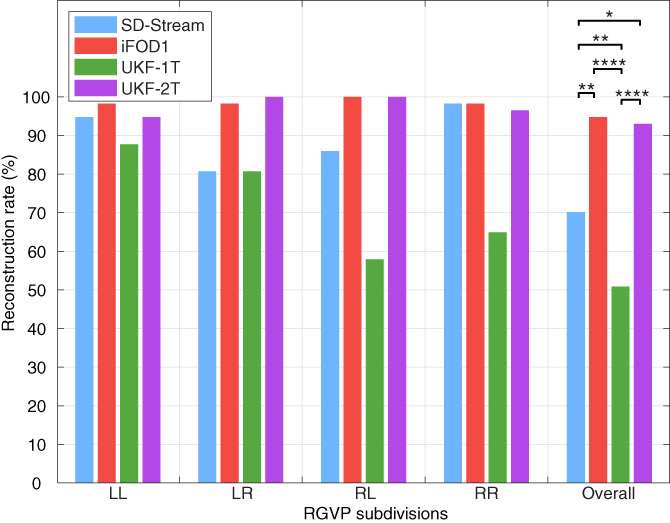
FIGURE 6.

Reconstruction rate of RGVP subdivisions using different tractography methods. The overall RGVP reconstruction rates were statistically significantly different across the four compared tractography methods (ANOVA, p < .0001). Posthoc two‐group Cochran's Q tests (with FDR correction) with significant results are indicated by asterisks. *: p < .05; **: p < .01; ****: p < .0001
