
FIGURE 9.
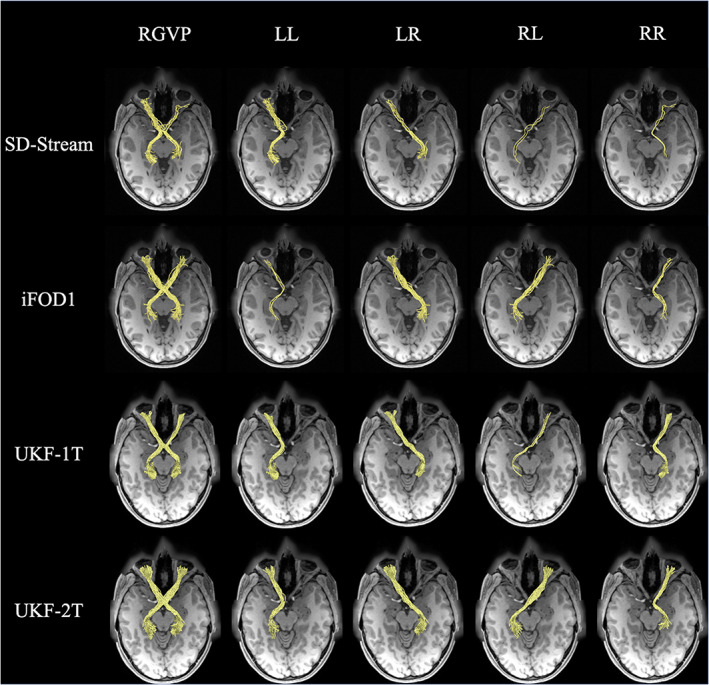
Visual comparison of the RGVP reconstructed using the four tractography methods. The RGVPs (yellow bundles) obtained from one HCP subject are displayed, overlaid on the T1w image. Each row shows the RGVP and its subdivisions using one of the tracking strategies. The first column shows the overall RGVP fiber pathway, and the following columns show the four subdivisions