
FIGURE 12.
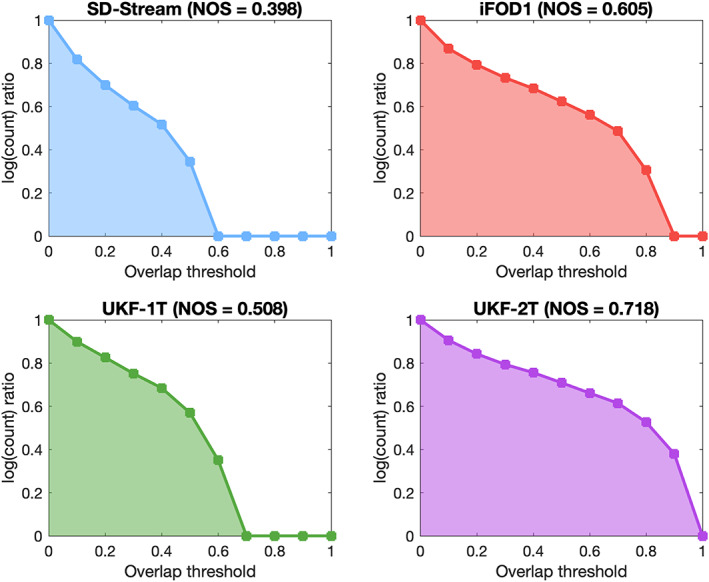
Normalized overlap score (NOS) of conjunction images generated by different tractography methods. The y‐axis shows the log ratio (the ratio that is summed in Equation (2)), while the x‐axis shows different threshold values of conjunction images. The NOS is the area under the curve