
FIGURE 2.
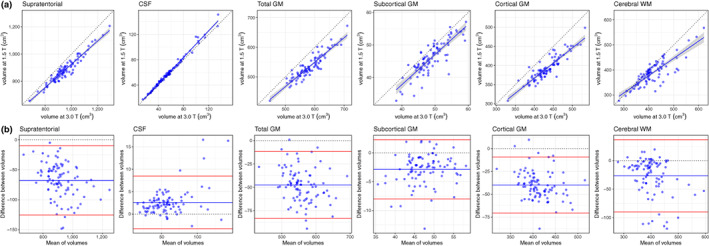
Between‐scanner comparison of T1‐weighted data: (a) scatter plots of six volumetric measures identified using FreeSurfer 6.0 for 91 participants scanned at both 1.5 and 3 T, where the continuous blue line shows linear fit with 95% CI; (b) Bland–Altman plots of the same six measures showing the mean of between‐scanner volumes and the difference between these volumes where the blue line indicates the mean and the red lines represent ±2 SDs. CSF, cerebrospinal fluid; GM, grey matter; WM, white matter