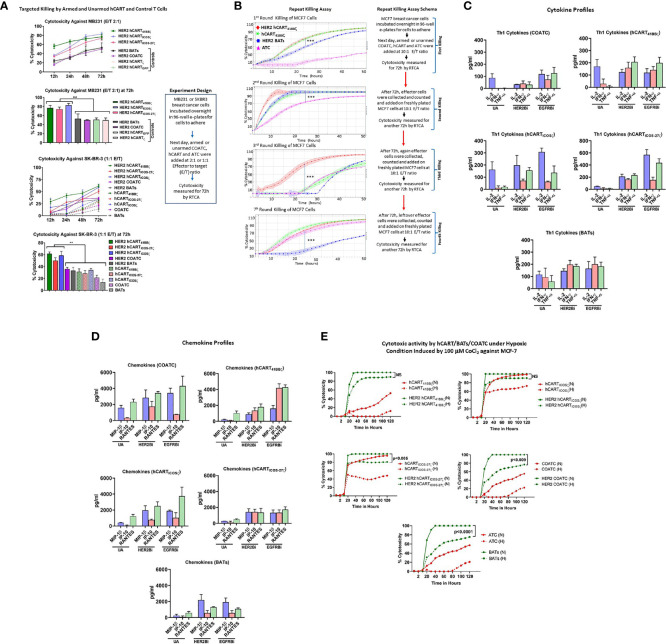
Figure 2.
(A) Specific Cytotoxicity by hCART Transduced with Different Vectors. Upper panel showing specific cytotoxicity by Headless CAR T cells (hCART) transduced by different constructs against MB231 from 12 to 72 hours at E:T of 2:1 using the real time cell analysis (RTCA) by xCelligence System (n=4, each condition had 3-4 replicates). The statistical analysis at 72 hours show significantly high specific cytotoxicity by HER2 bispecific antibody armed hCART41BBζ (HER2 hCART41BBζ; p<0.008), HER2 hCARTICOSζ (p<0.003) and HER2 hCARTICOS-27ζ (p<0.009) compared to controls-HER2 hCARTζ, HER2 hCARTGFP, HER2 bispecific antibody armed co-activated T cells (COATC) and HER2 bispecific antibody armed T cells (BATs) against MB231 cells (n=3, each condition had 4 replicates). Data is presented as mean ± SD of 4 replicates overtime and analyzed using Two-way ANOVA and Turkey’s multiple comparisons test. Lower panel shows the kinetics of cytotoxicity against SKBR3 cells by HER2Bi armed hCART, COATC, BATs and unarmed hCART, COATC and ATC controls from 12-72 hours. At 72h, specific cytotoxicity was significantly high by HER2 hCART41BBζ (p<0.001), HER2 hCARTICOSζ (p<0.001), HER2 hCARTICOS-27ζ (p<0.005) compared to HER2 COATC, HER2 BATs and unarmed hCART controls at E:T of 1:1 (n=4, each condition had 3 replicates). Data is presented as mean ± SD of 4 replicates overtime and analyzed using Two-way ANOVA and Turkey’s multiple comparisons test. (B) Serial Killing by hCART41BBζ and BATs. Shows specific cytotoxicity (Mean ± SD) by HER2 bispecific antibody armed hCART41BBζ (HER2 hCART41BBζ), HER2 BATs, unarmed (without BiAb loading) hCART41BBζ (green) and ATC (pink) against MCF-7 cell line measured by RTCA up to 4 rounds of serial killing (n=3, each condition had 4-6 replicates). Each killing was monitored up to 50 hours at E:T of 10:1. HER2 hCART41BBζ in all four killing rounds showed significantly higher cytotoxicity (p<0.0001) compared to one or more effector cells. Right panel shows the schema for repeat killing assay. Data is presented as mean ± SD of 4 replicates overtime and analyzed using Wilcoxon matched-pairs signed rank test. (C) Quantitative Cytokine Profiles of Culture Supernatants from Target (SKBR3) and Effector cells Co-culture. Th1 cytokines IL-2, IFN-γ and TNF-α in the culture supernatants are shown for unarmed (without BiAb loading) or armed with HER2Bi or EGFRBi hCART41BBζ, hCARTICOSζ, hCARTICOS-CD27ζ, COATC, ATC in the presence of target cells (SKBR3) co-cultures (n=2, each pooled from three replicates). Detailed statistical analysis is presented in Table S1 . (D) Quantitative Chemokine Profiles of Culture Supernatants. Shows the chemokine in the culture supernatant from same co-cultures described above. Detailed statistical analysis is presented in Table S1 . (E) Effect of Hypoxia on Effector Cell Functions. Showing cytotoxic activity by unarmed and HER2Bi armed hCART, COATC, ATC under normoxic (N) and hypoxic (H) conditions induced by 100 µM CoCl2 against MCF-7 cell line (n=3, each condition had 4-6 replicates). There were no significant functional difference found between normoxic (solid lines) and hypoxic (dashed lines) conditions on the cytotoxic effects of HER2 hCART41BBζ and HER2 hCARTICOSζ against MCF-7 cells in long term (120 hours) killing assay. Cytotoxicity by BATs (p<0.0001), COATC (p<0.009) and headless CAR T cells with ICOS-27ζ intracellular domain was significantly lower (p<0.005) under hypoxic condition compared to normoxia against MCF-7 cells. Data is presented as mean of 6 replicates overtime and analyzed using Wilcoxon matched-pairs signed rank test (***p < 0.0001, **p < 0.009.).

