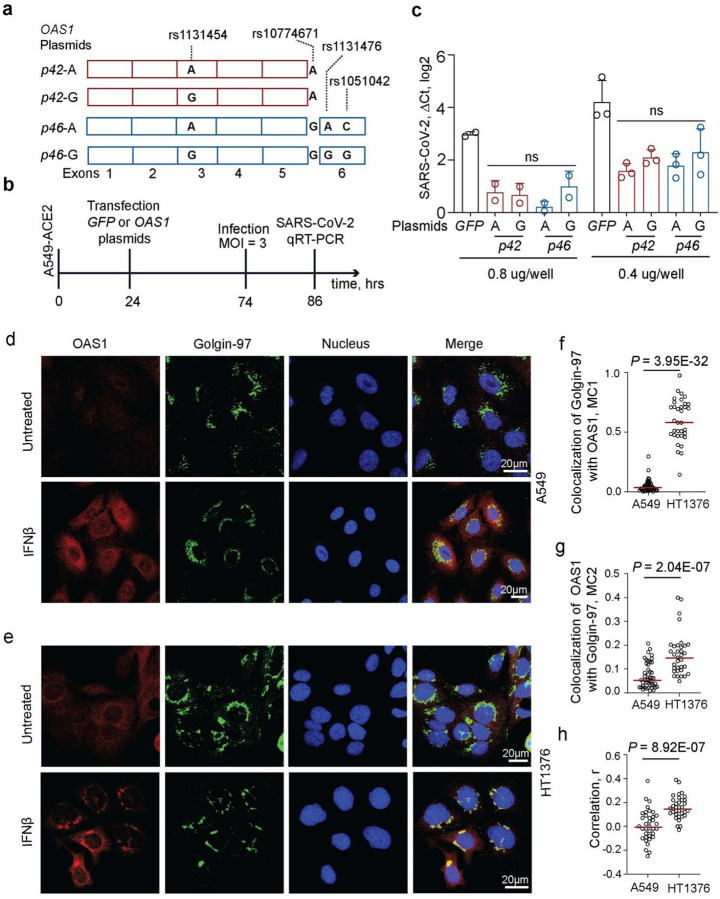
Figure 2. Anti-SARS-CoV-2 activity and subcellular localization of OAS1-p42 and p46 isoforms.
a) Description of OAS1-p42 and OAS1-p46 plasmids. b) Experiment outline: plasmids were transiently transfected in A549-ACE2 cells, followed by infection with SARS-CoV-2 and qRT-PCR for viral detection. c) SARS-CoV-2 load in A549-ACE2 cells transfected in duplicates or triplicates with 0.4 ug/well or 0.8 ug/well with OAS1 or GFP plasmids in six-well plates. Expression of SARS-CoV-2 was detected by qRT-PCR and normalized to the expression of an endogenous control (HPRT1). P-values between OAS1 plasmids are for ANOVA tests. d, e) Representative confocal images for endogenous OAS1 expression in untreated and IFNβ-treated A549 cells (rs10774671-AA, OAS1-p42, cytosolic expression) and HT1376 (rs10774671-GG, OAS1-p46, enrichment in trans-Golgi compartment); OAS1 (red), Golgin-97 (green) and nuclei (DAPI, blue). Scale bars, 20 μm. f) Mander’s coefficient 1 (MC1) for colocalization of Golgin-97 with OAS1 in confocal images. g) Mander’s coefficient 2 (MC2) for colocalization of OAS1 with Golgin-97 in confocal images. h) Overall correlation (Pearson’s, r) between colocalization of Golgin-97 and OAS1 expression in confocal images. P-values are for non-parametric, two-sided Mann–Whitney U tests.

