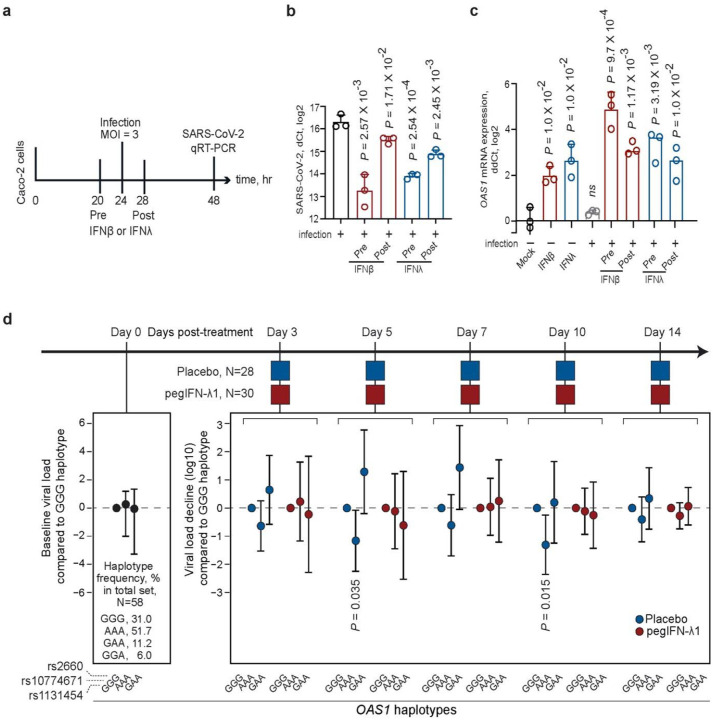
Figure 7. Effects of interferons on SARS-CoV-2 viral loads in vitro and in patients in a clinical trial.
a) Outline of an experiment in Caco2 cells: cells were infected with SARS-CoV-2 and treated with IFNβ or IFNλ four hours before or after infection, and SARS-CoV-2 and OAS1 expression was measured by qRT-PCR 24 hrs post-infection. Expression of b) SARS-CoV-2 and c) OAS1 normalized by the expression of endogenous control (HPRT1). P-values are for comparison with infection alone or Mock; d) Outline of the clinical trial: a single subcutaneous injection of 180ug pegIFNλ1 or saline placebo was administered at day 0 and decline of SARS-CoV-2 load (log10 copies per ml) was evaluated at indicated days compared to day 0. The viral load decline is presented comparing to OAS1-GGG haplotype (rs1131454-G, rs10774671-G, rs2660-G) and adjusting for age, sex, and viral load at day 0 (complete results are shown in Table S12).

